
 E-mail Alert
 RSS
RSS
Experimental research on negative pressure wave signal of optical fiber and electronic sensor
-
摘要:
负压波技术是管道泄漏监测的有效手段。为获取更精确的负压波拐点信息,提高信噪比,采用102.8 m管道实验平台,根据不同环境下传感器监测负压波信号,对光纤传感器与传统电子压力传感器在响应时间、静态稳定性、抗电磁干扰等方面进行了对比实验分析。实验结果表明,在同等的管道工况下,光纤传感器从泄漏负压波信号的获取到压力信号的重新恢复稳定约需30 ms,远优于电子传感器500 ms的响应时间。在静态稳定性实验中,光纤传感器压力信号输出稳定,压力波动范围±0.001 MPa,远小于电子传感器压力输出变化±0.006 MPa。综合评价分析表明,光纤传感器具有良好的稳定性及抗电磁干扰性能,在管道泄漏监测及能源、化工等领域有着广阔的应用前景。
 Abstract:
Abstract: Negative pressure wave technique is an effective method for pipeline leak detection. In order to obtain more accurate inflection point information of negative pressure wave and improve signal to noise ratio, experiments using 102.8 meters pipeline experimental platform, according to the negative pressure wave signal captured by the sensors, the response time, static stability and anti-electromagnetic interference of the optical fiber sensor and the traditional electronic pressure sensor are analyzed. Experimental results show that from the leakage of negative pressure wave signal acquisition to the pressure signal restore stability, optical fiber sensor takes about 30 ms, which is far better than the electronic sensor 500 ms. In the static stability experiment, the pressure signal output of optical fiber sensor is stable, and the pressure fluctuation range is ± 0.001 MPa, which is far less than the electronic sensor ± 0.006 MPa. Comprehensive evaluation analysis shows that the optical fiber sensor has good stability and anti-electromagnetic interference performance, and has wide application prospect in the fields of pipeline leakage monitoring, energy and chemical industry.
-
Key words:
- negative pressure wave /
- optical fiber sensor /
- response time /
- stability
-

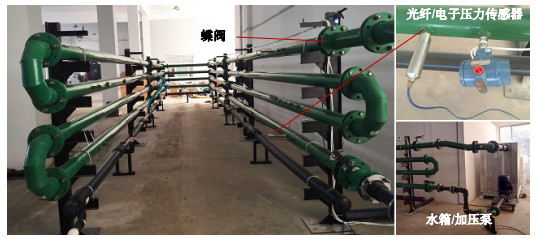
Negative pressure wave technique is an effective method for pipeline leak detection. However, the low sensitivity and poor locating accuracy seriously limit the applications of negative pressure wave in pipeline leakage detection. In order to obtain more accurate inflection point information of negative pressure wave and improve signal tonoise ratio, the response time, static stability and anti-electromagnetic interference of the optical fiber sensor and thetraditional electronic pressure sensor are analyzed.
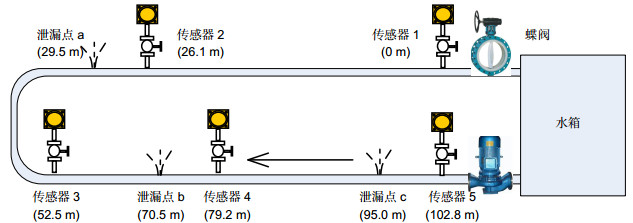
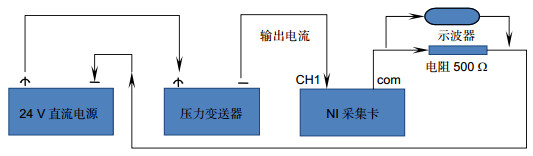
In the 102.8 meters pipeline experimental platform, the optical fiber sensor and the electronic sensor are set in pairs,with distance of about 10 cm, to open the leakage valve and compare the response time of both sensors according tothe negative pressure wave signal captured by the sensors. In the constant pressure state, collected pressure data afterthe signal is stable, recording the real-time pressure change and testing the long-term stability of the two sensors. Inorder to further verify the reliability of the data, the current output circuit of the electronic sensor is cascaded with 500Ω resistors, and the voltage of the two ends of the resistor is real-time monitored using the oscilloscope to test the stability of the sensor output current. At the same time, water cycle in the whole pipeline is powered by a water pump, sothere is 50 Hz frequency electromagnetic interference in the experimental environment, adjusting the internal pressure of the pipeline. After the pressure is stable, the pressure data of the two sensors are recorded, and comparativeanalyses to test the anti-electromagnetic interference performance are carried out.
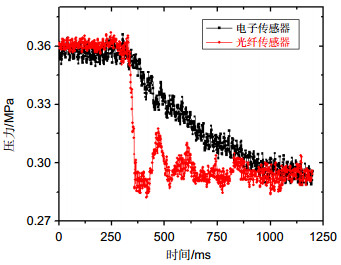
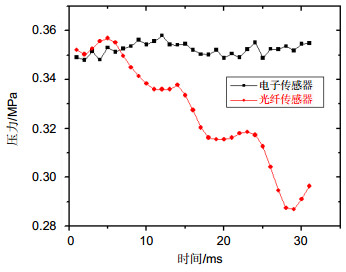
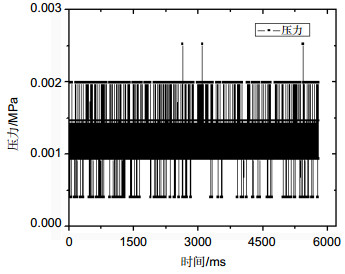
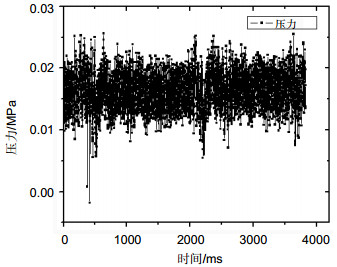
Experimental results show that optical fiber sensor takes about 30 ms, and negative pressure wave signal of theleakage is acquired to the pressure signal resumes stable, which is far better than the electronic sensor with the time of500 ms. In the static stability experiment, the pressure signal output of optical fiber sensor is stable, and the pressurefluctuation range is ± 0.001 MPa, which is far less than the electronic sensor’s ± 0.006 MPa. In the electromagneticinterference experiment, with the influence of the water flow and the vibration of the pipeline, the pressure value ofoptical fiber sensor has a small fluctuation, and the fluctuation range is about ± 0.01 MPa. As to the electronic sensor,due to the sensitivity to electrical interference, the monitored pressure fluctuation range is ± 0.005 MPa, which is accompanied by pressure mutation point. Comprehensive evaluation analysis shows that the optical fiber sensor hasexcellent stability and electromagnetic interference resistant performance, and has wide application prospect in thefields of pipeline leakage monitoring, energy and chemical industry.
-

-
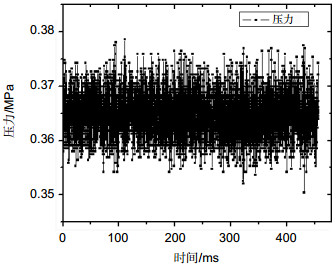
图 7 光纤传感器抗电磁干扰测试图.
Figure 7. Anti-electromagnetic interference test of optical fiber sensor.
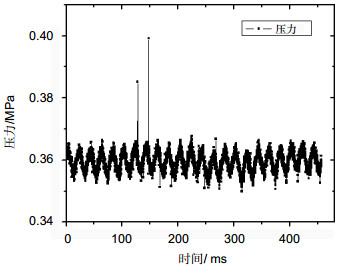
图 8 电子传感器抗电磁干扰测试图.
Figure 8. Anti-electromagnetic interference test of electronic sensor.
-
[1] 王立坤, 王洪超, 熊敏, 等.长距离输油管道泄漏监测技术分析及研究建议[J].油气储运, 2014, 33(11): 1198–1201. http://kns.cnki.net/KCMS/detail/detail.aspx?filename=yqcy201411013&dbname=CJFD&dbcode=CJFQ
Wang Likun, Wang Hongchao, Xiong Min, et al. Analysis and proposal on leak detection of long-distance oil pipeline[J]. Oil & Gas Storage and Transportation, 2014, 33(11): 1198–1201. http://kns.cnki.net/KCMS/detail/detail.aspx?filename=yqcy201411013&dbname=CJFD&dbcode=CJFQ
[2] Girgin S, Krausmann E. Historical analysis of U.S. onshore hazardous liquid pipeline accidents triggered by natural hazards[J]. Journal of Loss Prevention in the Process Industries, 2016, 40: 578–590. doi: 10.1016/j.jlp.2016.02.008
[3] Bariha N, Mishra I M, Srivastava V C. Hazard analysis of failure of natural gas and petroleum gas pipelines[J]. Journal of Loss Prevention in the Process Industries, 2016, 40: 217–226. doi: 10.1016/j.jlp.2015.12.025
[4] Li Yibo, Sun Liying. Leakage detection and location for long range oil pipeline using negative pressure wave technique[C]// Proceedings of the 4th IEEE Conference on Industrial Electronics and Applications, 2009: 3220–3224.
[5] 伞海生, 宋子军, 王翔.适用于恶劣环境的MEMS压阻式压力传感器[J].光学精密工程, 2012, 20(3): 550–554. http://dspace.xmu.edu.cn/bitstream/handle/2288/15827/%e9%80%82%e7%94%a8%e4%ba%8e%e6%81%b6%e5%8a%a3%e7%8e%af%e5%a2%83%e7%9a%84MEMS%e5%8e%8b%e9%98%bb%e5%bc%8f%e5%8e%8b%e5%8a%9b%e4%bc%a0%e6%84%9f%e5%99%a8.pdf?sequence=1&isAllowed=y
San Haisheng, Song Zijun, Wangxiang. Piezoresistive pressure sensors for harsh environments[J]. Optics and Precision Engineering, 2012, 20(3): 550–554. http://dspace.xmu.edu.cn/bitstream/handle/2288/15827/%e9%80%82%e7%94%a8%e4%ba%8e%e6%81%b6%e5%8a%a3%e7%8e%af%e5%a2%83%e7%9a%84MEMS%e5%8e%8b%e9%98%bb%e5%bc%8f%e5%8e%8b%e5%8a%9b%e4%bc%a0%e6%84%9f%e5%99%a8.pdf?sequence=1&isAllowed=y
[6] 郑志霞, 冯勇建. MEMS接触电容式高温压力传感器的温度效应[J].电子测量与仪器学报, 2013, 27(12): 1141–1147. http://dspace.xmu.edu.cn/handle/2288/105600?show=full
Zheng Zhixia, Feng Yongjian. Temperature effect of MEMS high temperature touch-mode capacitive pressure sensor[J]. Journal Of Electronic Measurement and Instrument, 2013, 27(12): 1141–1147. http://dspace.xmu.edu.cn/handle/2288/105600?show=full
[7] Wan Shu, Bi Hengchang, Zhou Yilong, et al. Graphene oxide as high-performance dielectric materials for capacitive pressure sensors[J]. Carbon, 2017, 114: 209–216. doi: 10.1016/j.carbon.2016.12.023
[8] Zhu Jiali, Wang Ming, Chen Lu, et al. An optical fiber Fabry–Perot pressure sensor using corrugated diaphragm and angle polished fiber[J]. Optical Fiber Technology, 2017, 34: 42–46. doi: 10.1016/j.yofte.2016.12.004
[9] 何少灵, 郝凤欢, 刘鹏飞.温度实时补偿的高精度光纤光栅压力传感器[J].中国激光, 2015, 42(6): 0605003. http://www.opticsjournal.net/Articles/Abstract?aid=OJ150428000040y6B8Ea
He Shaoling, Hao Fenghuan, Liu Pengfei. High precision fiber Bragg grating pressure sensor with real-time temperature compensation[J]. Chinese Journal of Lasers, 2015, 42(6): 0605003. http://www.opticsjournal.net/Articles/Abstract?aid=OJ150428000040y6B8Ea
[10] 王辉, 杨洋, 刘兵.基于密集波分复用器的光纤光栅压力传感器解调方法[J].激光与光电子学进展, 2016, 53: 042803. http://kns.cnki.net/KCMS/detail/detail.aspx?filename=jgdj201604032&dbname=CJFD&dbcode=CJFQ
Wang Hui, Yang Yang, Liu Bing. Dense Wavelength Division Multiplexing-Based Demodulation of Fiber Bragg Grating Pressure Sensor[J]. Laser & Optoelectronics Progress, 2016, 53: 042803. http://kns.cnki.net/KCMS/detail/detail.aspx?filename=jgdj201604032&dbname=CJFD&dbcode=CJFQ
[11] 张黎明, 张小栋, 牛杭.齿轮弯曲应力的光纤动态测试系统设计[J].光电工程, 2016, 43(3): 36–40. http://www.cnki.com.cn/Article/CJFDTOTAL-GDGC201603007.htm
Zhang Liming, Zhang Xiaodong, Niu Hang. Design on optical fiber dynamic testing system of gear bending stress[J].Opto-Electronic Engineering, 2016, 43(3): 36–40. http://www.cnki.com.cn/Article/CJFDTOTAL-GDGC201603007.htm
[12] 黄俊. 光纤光栅压力传感器的研制与应用[D]. 武汉: 武汉理工大学, 2013.
Huang Jun. Development and application of fiber Bragg grating pressure sensors[D]. Wuhan: Wuhan University of Technology, 2013.
[13] 姜龙, 李连庆, 孙剑锋, 等. 可实现正负压监测的光纤光栅压力传感器及测试方法: CN103900756[P]. 2014-07-02.
[14] 顾丽. 基于HART协议的电容式差压/压力变送器设计[D]. 哈尔滨: 哈尔滨理工大学, 2010.
Gu Li. Design of capacitive differential pressure & pressure transmitter based on HART protocol[D]. Harbin: Harbin University of Science and Technology, 2010.
[15] 屈仁超.光电传感器响应时间的准确测量方法[J].电子质量, 2014(4): 64–66. http://www.doc88.com/p-5971284040810.html
Qu Renchao. Accurate measurement of photoelectric sensor response time[J]. Electronics Quality, 2014(4): 64–66. http://www.doc88.com/p-5971284040810.html
[16] 孙良, 王建林, 赵利强.负压波法在液体管道上的可检测泄漏率分析[J].石油学报, 2010, 31(4): 654–658. doi: 10.7623/syxb201004026
Sun Liang, Wang Jianlin, Zhao Liqiang. Analysis on detectable leakage ratio of liquid pipeline by negative pressure wave method[J]. Acta Petrolei Sinica, 2010, 31(4): 654–658. doi: 10.7623/syxb201004026
-
 下载:
下载:

 点击扫一扫
点击扫一扫
图(12)
计量
- 文章访问数: 8141
- PDF下载数: 3123
- 施引文献: 0


