
 E-mail Alert
 RSS
RSS
| Citation: |

|
Wavelet packet energy analysis of laser ultrasonic
-
Abstract
In order to solve the problem of the rapid detection of aircraft engine in situ cracks, and get the relationship between feature information and detect depth, the laboratory experimental platform is built, laser is used to excite laser ultrasonic signals on a range of aviation aluminum plates with different depth defects, the collected signal is proposed by wavelet de-noising, and the band energy distribution of the reflected echo signal is studied by using wavelet packet. The results show that the energy of reflected echo signal is mainly concentrated in the S80~S87 band. When the depth of defect is 0.2 mm to 0.4 mm, the energy is mainly concentrated in the adjacent bands. When the depth of defect is 0.5 mm to 0.7 mm, the energy is mainly concentrated in the two bands. This method provides a way to quantify surface micro-defects by ultrasonic signals, which will lay a foundation for the future analysis of crack depth from band energy.-
Keywords:
- laser ultrasonic /
- wave packet decomposition /
- band energy /
- reflection echo /
- defect depth
-

-
References
[1] Sun Guangkai, Zhou Zhenggan, Li Guanghai, et al. Development of an optical fiber-guided robotic laser ultrasonic system for aeronautical composite structure testing[J]. Optik, 2016, 127(12): 5135-5140. doi: 10.1016/j.ijleo.2016.02.076 [2] Liu I H, Yang Chehua. A novel procedure employing laser ultrasound technique and simplex algorism for the characterization of mechanical and geometrical properties in Zircaloy tubes with different levels of hydrogen charging[J]. Journal of Nuclear Materials, 2011, 408(1): 96-101. doi: 10.1016/j.jnucmat.2010.11.018 [3] Ayers J, Apetre N, Ruzzene M, et al. Measurement of Lamb wave polarization using a one-dimensional scanning laser vibrometer (L)[J]. The Journal of the Acoustical Society of America, 2011, 129(2): 585-588. doi: 10.1121/1.3523429 [4] 曾荣军. 激光超声表面波检测的实验研究[D]. 南昌: 南昌航空大学, 2012. Zeng Rongjun. Experimental research of the laser ultrasonic surface wave detection[D]. Nanchang: Nanchang Hangkong University, 2012. [5] 曹建树, 曹振, 赵龙飞, 等.激光超声管道表面裂纹检测技术[J].光电工程, 2016, 43(3): 1-6. Cao Jianshu, Cao zhen, Zhao Longfei, et al. Detecting techniques of surface crack of surface crack of pipeline based on laser ultrasonic[J].Opto-Elec Eng, 2016, 43(3): 1-6. [6] Dubois M, Drake T E, Jr. Evolution of industrial laser-ultrasonic systems for the inspection of composites[J]. Nondestructive Testing and Evaluation, 2011, 26(3-4): 213-228. doi: 10.1080/10589759.2011.573552 [7] Dubois M, Drake T E, Osterkamp M. Low-cost ultrasonic inspection of composites for aerospace applications with Laser UT® technology[J]. Journal of the Japanese Society for Non-Destructive Inspection, 2008, 57(1): 11-20. [8] Lee J R, Chia C C. Laser ultrasonic anomalous wave propagation imaging method with adjacent wave subtraction: algorithm[J]. Optics & Laser Technology, 2012, 44(5): 1507-1515. [9] 周正干, 孙广开, 李征, 等.激光超声检测技术在复合材料检测中的应用[J].哈尔滨理工大学学报, 2012, 17(6): 119-122. Zhou Zhenggan, Sun Guangkai, Li Zheng, et al. Application of laser ultrasonic testing technique on the detection of composite structures[J]. Journal of Harbin University of Science and Technology, 2012, 17(6): 119-122. [10] 小波分析及其应用[M].北京:机械工业出版社, 2005: 245-260. [11] 凌同华, 李夕兵.多段微差爆破振动信号频带能量分布特征的小波包分析[J].岩石力学与工程学报, 2005, 24(7): 1117-1122. Ling Tonghua, Li Xibing. Analysis of energy distributions of millisecond blast vibration signals using the wavelet packet method[J]. Chinese Journal of Rock Mechanics and Engineering, 2005, 24(7): 1117-1122. [12] 朱权洁, 姜福兴, 于正兴, 等.爆破震动与岩石破裂微震信号能量分布特征研究[J].岩石力学与工程学报, 2012, 31(4): 723-730. Zhu Quanjie, Jiang Fuxing, Yu Zhengxing, et al. Study on energy distribution characters about blasting vibration and rock fracture microseismic signal[J]. Chinese Journal of Rock Mechanics and Engineering, 2012, 31(4): 723-730. [13] 路亮, 龙源, 谢全民, 等.爆破振动信号的提升小波包分解及能量分布特征[J].爆炸与冲击, 2013, 33(2): 140-147. doi: 10.11883/1001-1455(2013)02-0140-08 Lu Liang, Long Yuan, Xie Quanmin, et al. Decomposition and energy distribution of blasting vibration signal based on second generation wavelet packet (SGWP)[J]. Explosion and Shock Waves, 2013, 33(2): 140-147. doi: 10.11883/1001-1455(2013)02-0140-08 -
Overview

Abstract: The blades on the plane are one of the most important parts of the engine, in the course of service, due tohigh temperature, strong vibration and great centrifugal force and so on. The using environment is very bad, so it iseasy to produce fatigue cracks in the welding site and the near surface of the root, which will seriously affect the bladeof the work intensity and fatigue life, and even the safety of aircraft structure, causing a huge security risk. Therefore, itmust be tested. In order to solve the problem of the rapid detection of aircraft engine in situ cracks, and gett the relationship between feature information and detect depth, the laboratory experimental platform was built, laser was usedto excite laser ultrasonic signals on a range of aviation aluminum plates with different depth defects, the collected signal was processed by wavelet de-noising, and the band energy distribution of the reflected echo signal was studied byusing wavelet packet. The results show that the energy of reflected echo signal is mainly concentrated in the S80~S87band. When the depth of defect is 0.2 mm to 0.4 mm, the energy is mainly concentrated in the adjacent bands. Whenthe depth of defect is 0.5 mm to 0.7 mm, the energy is mainly concentrated in the two bands. This method provides away to quantify surface micro-defects by ultrasonic signals, which will lay a foundation for the future analysis of crackdepth from band energy.
In order to avoid the interference of other irregular cracks, the cracks of the aviation aluminum parts are used as artificial way for producing. The overall size of the specimen is 200 mm×80 mm×100 mm, the width of the defect is 0.15mm, the range of the defect depth is 0.2 mm~0.7 mm, step size is 0.1 mm, and the total number of the specimen is six.After the experimental data is proposed, choosing the reflected echo signal for analysis, performing wavelet packettransform, the decomposition layer is 8. The percentage in the S80~S87 band is 89.77%、 91.82%、 91.41%、 90.94%、90.19%、 and 87.86%. The result shows that most of the energy is concentrated in the first eight bands. Therefore, thepaper selects the first eight bands for analysis.
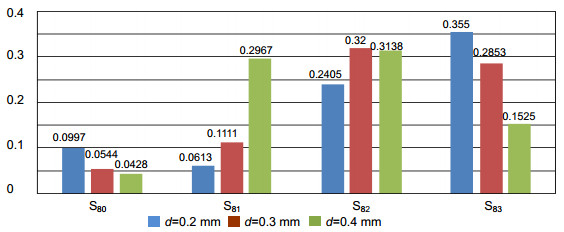
In order to analyze the distribution characteristics of the different depth defect and the band energy, the energy distribution of the first four bands of the defect depth of 0.2 mm to 0.4 mm is plotted in Fig, according to the spectrum,getting the center frequency were 3.14 MHz, 2.58 MHz, 2.17 MHz. These frequencies are located in the S83, S82, S82band, respectively, which are the largest energy band, but the energy distribution in the adjacent segment S82 also accounts for a larger proportion. When the depth of the defect increases from 0.2 mm to 0.4 mm, the center frequencydecreases gradually, and the sum of the energy of the center frequency band and the adjacent higher energy band increases gradually.
-
Access History
Export File
Citation
Format
Content
 DownLoad:

-
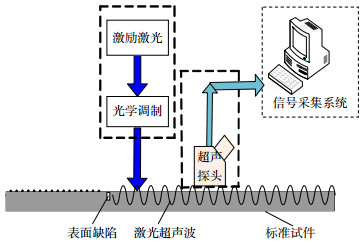
Figure 1.
Experimental device block diagram.
-
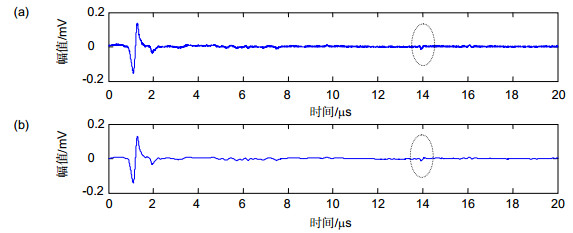
Figure 2.
Preprocessing of reflected wave signals. (a) Wavefront before preprocessing. (b) Wavefront after preprocessing.
-
Figure 3.
The frequency distribution of the reflected echo signals.
-
Figure 4.
Energy distribution histogram.
-
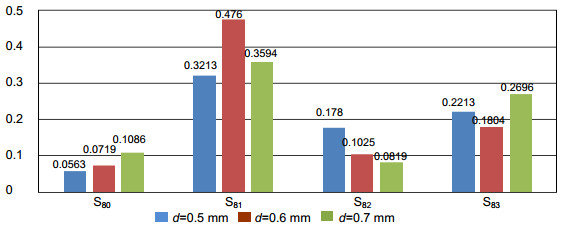
Figure 5.
Energy distribution histogram.


