
 E-mail Alert
 RSS
RSS
Multiband fusion image evaluation method based on correlation between subject and object evaluation
-
摘要:
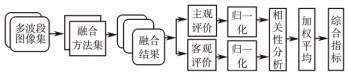
针对图像融合难以选择合适的评价指标的问题,通过分析主观评价与客观评价指标之间的相关性,提出一种合成评价指标方法对多波段图像融合结果进行评价。首先,从边缘清晰度、自然感、信息量及综合评价四个方面对多种方法融合结果进行主观评价;其次,用14种常用的客观评价指标对融合结果进行评价;然后,对主客观评价结果分别归一化,并采用斯皮尔曼(Spearman)相关系数分析每种客观评价指标和四种主观评价之间的相关性;最后,根据该相关性分别从四个评价方面,用14种客观指标合成一种综合指标。实验结果表明,综合指标与主观评价的相关性比单项指标或其他合成指标更高。
 Abstract:
It is difficult to select an appropriate evaluation index for current image fusion. In order to solve the problem, a synthesis evaluation index is proposed based on the correlation between subjective and objective evaluations. First, a variety of fusion results are evaluated subjectively from the edge of clarity, natural sense, information and comprehensive evaluation, respectively. Secondly, 14 commonly objective indexes are used to evaluate the fusion results. Then, the subjective and objective results are normalized, and the Spearman correlation coefficient is used to analyze the correlation between the four subjective evaluations and each objective evaluation. Finally, according to the correlation, a comprehensive index is constructed through 14 objective indexes in 4 aspects. The experimental results show that the synthesis index is more relevant to subjective evaluation than the individual evaluation index and any other comprehensive indexes.
-

Abstract: Image fusion is an important branch of multi-sensor information fusion, which is to synthesize several images or sequential detective images about one scene into a more complete and thorough image. At present, this technology has achieved a universal usage in remote sense detection, computer vision, target detection and recognition, etc. However, because of the variances of fusion image type, there is no standard evaluation method. Researchers have to select some appropriate evaluation indicators from a number of objective evaluation indicators by experience. The result is that different studies select different evaluation indicators, and it is hard to compare, which leads to lower persuasion in theory study. The hot issue on nowadays study is to choose relative evaluation indicators according to evaluation targets, and synthesize the chosen evaluation indicators to a comprehensive indicator. Indicator accuracy can be achieved through complementary advantages among indicators. An evaluation method of multiband fusion image is proposed based on the correlation of subjective and objective evaluations. This evaluation method includes the following steps. First, subjectively evaluate a variety of fusion results from four aspects. They are the clarity of edge, natural sense, information quantity and comprehensive evaluation. The evaluation level is divided into five levels:"good", "better", "normal", "poor" and"bad". Secondly, calculate the 14 objective evaluation indicators of the fusion results. Thirdly, normalize the subjective and objective evaluation results. Fourthly, use relative Spearman coefficient to calculate the correlation among each evaluation aspect and the 14 objective evaluation indicators. Fifthly, use the correlation to calculate the occupation weight of each objective evaluation indicator in the comprehensive evaluation indicator. Finally, construct a comprehensive index based on the correlation of the 14 indexes for every objective evaluation.
The experimental results show that the synthesis indicator based on correlation between subject and object evaluation is more relevant to the objective evaluations than the individual evaluation indicator, CMSVD (complex matrix singular value decomposition) and MSA (multi-hierarchical synthesis analysis). The correlation of clarity of edge, natural sense, information quantity and comprehensive evaluation are 0.634, 0.630, 0.737, and 0.661, respectively. As for different evaluation aspects, the correlations between the objective evaluation and subjective evaluation are different. However, the correlations of AG (average gradient), SF (spatial frequency) and VIFF (visual information fidelity for fusion) are relatively higher than other aspects.
-

-
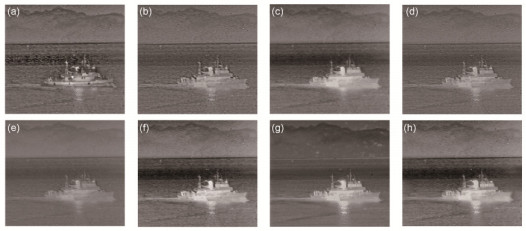
图 2 第1组待评价图像. (a) RP融合结果图. (b) NSCT融合结果图. (c) PCA融合结果图. (d) SVT融合结果图. (e) AVG融合结果图. (f) LPSR融合结果图. (g) SR融合结果图. (h) DCNN融合结果图.
Figure 2. Group 1 image to be evaluated. (a) RP fusion result. (b) NSCT fusion result. (c) PCA fusion result. (d) SVT fusion result. (e) AVG fusion result. (f) LPSR fusion result. (g) SR fusion result. (h) DCNN fusion result.
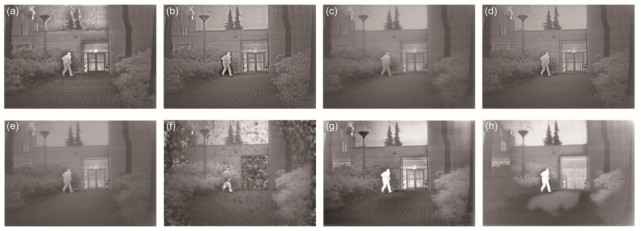
图 3 第2组待评价图像. (a) RP融合结果图. (b) NSCT融合结果图. (c) PCA融合结果图. (d) SVT融合结果图. (e) AVG融合结果图. (f) LPSR融合结果图. (g) SR融合结果图. (h) DCNN融合结果图.
Figure 3. Group 2 image to be evaluated. (a) RP fusion result. (b) NSCT fusion result. (c) PCA fusion result. (d) SVT fusion result. (e) AVG fusion result. (f) LPSR fusion result. (g) SR fusion result. (h) DCNN fusion result.
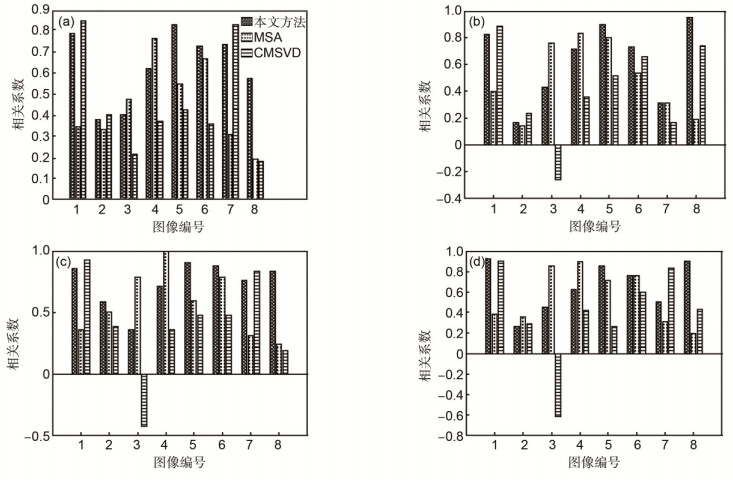
图 4 三种综合指标与主观评价相关系数图. (a)边缘清晰度相关系数图. (b)自然感相关系数图. (c)信息量相关系数图. (d)综合评价相关系数图.
Figure 4. Correlation coefficient between three comprehensive indexes and subjective evaluation. (a) Clarity of edge correlation coefficient. (b) Natural sense correlation coefficient. (c) Information correlation coefficient. (d) Comprehensive evaluation correlation coefficient.
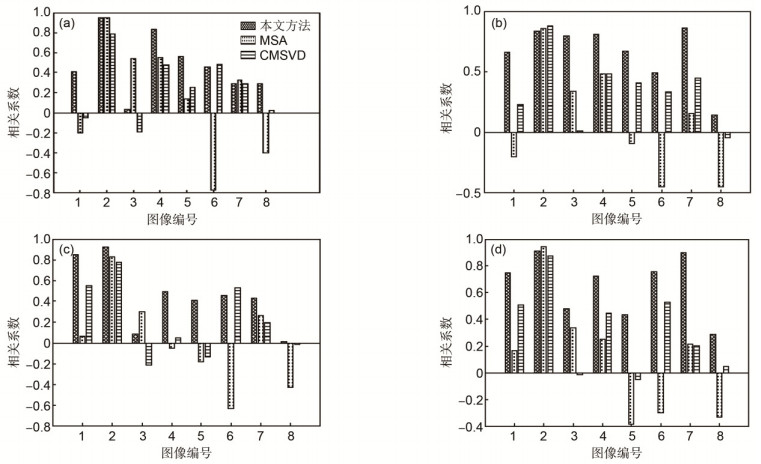
图 5 验证实验三种综合指标与主观评价相关系数图. (a)边缘清晰度相关系数图. (b)自然感相关系数图. (c)信息量相关系数图. (d)综合评价相关系数图.
Figure 5. Correlation coefficient between three comprehensive indexes and subjective evaluation of validation experiment. (a) Clarity of edge correlation coefficient. (b) Natural sense correlation coefficient. (c) Information correlation coefficient. (d) Comprehensive evaluation correlation coefficient.
表 1 主观评价参考表.
Table 1. Subjective evaluation reference form.
等级 分值 边缘清晰度 自然感 信息量 综合评价 好 5 物体的边缘清晰锐利,纹理细节丰富,很容易将各物体区分 图像干净无失真、光线分布均匀,整体感觉自然舒服 场景中纹理清楚,细节信息多,一眼就能找到 综合边缘清晰度、自然感、信息量最好 较好 4 物体的边缘清晰,很容易将各物体区分开 没有明显块状、条状或点状失真,不影响观看 场景中纹理清楚,细节信息较多,很容易就能找到 综合边缘清晰度、自然感、信息量较好 一般 3 物体的边缘没有锯齿或失真,不影响观看 有少量失真,但画面过度自然,不影响观看 场景部分纹理、细节信息,不需费力就能找到 综合边缘清晰度、自然感、信息量一般 较差 2 物体的边缘是少量的锯齿或失真,轻微影响观看 有少量块状、条状或点状失真,画面过度不自然,感觉轻微不适 场景中有部分纹理细节信息,需要费力才能找到 综合边缘清晰度、自然感、信息量较差 差 1 物体的边缘是有严重的锯齿或失真,严重影响观看 有大量块状、条状或点状失真,画面过度不自然,感觉不适 场景中完全没有纹理等细节信息 综合边缘清晰度、自然感、信息量差  下载: 导出CSV
表 2 主观评价结果.
Table 2. Subjective evaluation results.
图像 评价方面 RP NSCT PCA SVT AVG LPSR SR DCNN 第1组 清晰度 3.47 3.85 2.76 3.85 1.52 3.38 2.90 2.80 自然感 2.85 3.85 2.80 3.80 2.38 3.04 2.80 2.80 信息量 3.57 4.04 3.09 3.47 1.90 3.33 2.90 2.76 综合 3.23 3.88 2.84 3.57 2.28 2.93 2.90 2.66 第2组 清晰度 3.90 3.95 2.95 4.04 3.00 3.95 1.47 2.04 自然感 3.80 3.61 3.47 4.23 3.33 3.28 1.52 1.76 信息量 4.42 4.09 2.90 3.80 2.71 3.71 1.76 1.52 综合 3.79 3.90 3.20 3.82 2.88 3.79 1.73 1.69
下载: 导出CSV
表 3 主客观评价指标的平均相关系数及权重表.
Table 3. Average correlation coefficients and weight table of subjective and objective evaluation.
指标 相关系数 权重 清晰度 自然感 信息量 综合 清晰度 自然感 信息量 综合 SD -0.033 -0.241 -0.073 -0.174 -0.050 -0.131 -0.059 -0.114 IE 0.147 -0.062 0.099 0.004 0.044 -0.034 0.039 0.002 AG 0.471 0.284 0.546 0.392 0.140 0.133 0.218 0.174 SF 0.420 0.248 0.511 0.356 0.125 0.116 0.204 0.158 C -0.017 -0.220 -0.090 -0.167 -0.025 -0.120 -0.073 -0.109 MI -0.245 -0.395 -0.457 -0.426 -0.368 -0.215 -0.368 -0.278 PSNR -0.038 0.229 0.086 0.176 -0.058 0.107 0.034 0.078 CC 0.128 0.274 0.017 0.152 0.038 0.128 0.007 0.067 SSIM 0.252 0.235 0.017 0.145 0.075 0.110 0.007 0.064 EIPV 0.295 0.129 0.099 0.130 0.088 0.060 0.039 0.057 VIFF 0.569 0.396 0.579 0.477 0.170 0.185 0.231 0.211 IFQI 0.298 0.044 0.158 0.083 0.089 0.021 0.063 0.037 WFQI 0.379 0.108 0.223 0.156 0.113 0.051 0.089 0.069 EFQI 0.393 0.189 0.170 0.183 0.117 0.088 0.068 0.081
下载: 导出CSV
表 4 三种合成方法与主观评价平均相关系数.
Table 4. Average correlation coefficient of three methods.
清晰度 自然感 信息量 综合 CMSVD 0.455 0.412 0.402 0.388 MSA 0.455 0.496 0.571 0.558 本文方法 0.634 0.630 0.737 0.661
下载: 导出CSV
表 5 验证实验三种合成方法与主观评价平均相关系数.
Table 5. Validation experiment average correlation coefficient of three methods.
清晰度 自然感 信息量 综合 CMSVD 0.258 0.342 0.217 0.318 MSA 0.138 0.078 0.019 0.113 本文方法 0.478 0.657 0.456 0.653
下载: 导出CSV
-
[1] Li Shutao, Kang Xudong, Fang Leyuan, et al. Pixel-level image fusion: a survey of the state of the art [J]. Information Fusion, 2017, 33: 100–112. doi: 10.1016/j.inffus.2016.05.004
[2] Ding Li, Huang Hua, Zang Yu. Image quality assessment using directional anisotropy structure measurement [J]. IEEE Transactions on Image Processing, 2017, 26(4): 1799–1809. doi: 10.1109/TIP.2017.2665972
[3] Krasula L, Le Callet P, Fliegel K, et al. Quality assessment of sharpened images: challenges, methodology, and objective metrics [J]. IEEE Transactions on Image Processing, 2017, 26(3): 1496–1508. doi: 10.1109/TIP.2017.2651374
[4] Vega M T, Mocanu D C, Stavrou S, et al. Predictive no-reference assessment of video quality [J]. Signal Processing: Image Communication, 2017, 52: 20–32. doi: 10.1016/j.image.2016.12.001
[5] Alaql O Ghazinour K, Lu Cheng Chang. Classification of image distortions for image quality assessment [C]// Proceedings of International Conference on Computational Science and Computational Intelligence. 2016: 653–658.
[6] 颜文, 龚飞, 周颖, 等.基于NSST与自适应PCNN相结合的卫星云图融合[J].光电工程, 2016, 43(10): 70–76, 83. doi: 10.3969/j.issn.1003-501X.2016.10.012
Yan Wen, Gong Fei, Zhou Ying, et al. Satellite cloud image fusion based on adaptive PCNN and NSST [J]. Opto-Electronic Engineering, 2016, 43(10): 70–76, 83. doi: 10.3969/j.issn.1003-501X.2016.10.012
[7] 殷明, 段普宏, 褚标, 等.结合SIST和压缩感知的CT与MRI图像融合[J].光电工程, 2016, 43(8): 47–52. http://www.wanfangdata.com.cn/details/detail.do?_type=perio&id=gdgc201608008
Yin Ming, Duan Puhong, Chu Biao, et al. CT and MRI medical image fusion based on shift-invariant shearlet transform and compressed sensing [J]. Opto–Electronic Engineering, 2016, 43(8): 47–52. http://www.wanfangdata.com.cn/details/detail.do?_type=perio&id=gdgc201608008
[8] 张学典, 汪泓, 江旻珊, 等.显著性分析在对焦图像融合方面的应用[J].光电工程, 2017, 44(4): 435–441. http://www.oejournal.org/J/OEE/Article/Details/A170829000023/CN
Zhang Xuedian, Wang Hong, Jiang Minshan, et al. Applications of saliency analysis in focus image fusion [J]. Opto-Electronic Engineering, 2017, 44(4): 435–441. http://www.oejournal.org/J/OEE/Article/Details/A170829000023/CN
[9] Liu Yu, Chen Xun, Peng Hu, et al. Multi-focus image fusion with a deep convolutional neural network [J]. Information Fusion, 2017, 36: 191–207. doi: 10.1016/j.inffus.2016.12.001
[10] Zhang Kai, Wang Min, Yang Shuyuan. Multispectral and hyperspectral image fusion based on group spectral embedding and low-rank factorization [J]. IEEE Transactions on Geoscience and Remote Sensing, 2017, 55(3): 1363–1371. doi: 10.1109/TGRS.2016.2623626
[11] Wang Zhou, Bovik A C. A universal image quality index [J]. IEEE Signal Processing Letters, 2002, 9(3): 81–84 doi: 10.1109/97.995823
[12] He Guiqing, LiangFan, Xing Siyuan, et al. Study on algorithm evaluation of image fusion based on multi-hierarchical synthetic analysis[C]// Proceedings of 2016 IEEE International Conference on Signal Processing, Communications and Computing, 2016: 1–6.
https://ieeexplore.ieee.org/document/7753704/ [13] 朱亚辉. 红外与可见光图像融合质量评价方法研究[D]. 西安: 西北工业大学, 2015.
Zhu Yahui. Research on quality evaluation methods of infrared and visible image fusion[D]. Xi'an: Northwestern Polytechnical University, 2015.
[14] Xydeas C S, Petrovic V. Objective image fusion performance measure[J]. Electronics Letters, 2000, 36(4): 308–309. doi: 10.1049/el:20000267
[15] Piella G, Heijmans H. A new quality metric for image fusion [C]// Proceedings of 2003 International Conference on Image Pro-cessing, 2003, 2: Ⅲ-173–176.
[16] Nizami I F, Majid M, Khurshid K. Efficient feature selection for blind image quality assessment based on natural scene statistics [C]// Proceedings of 2017 14th International Bhurban Conference on Applied Sciences and Technology, 2017: 318–322.
https://ieeexplore.ieee.org/document/7868071/ [17] Ding Yong, Zhao Yang, Zhao Xinyu. Image quality assessment based on multi-feature extraction and synthesis with support vector regression [J]. Signal Processing: Image Communication, 2017, 54: 81–92. doi: 10.1016/j.image.2017.03.001
[18] Mukherjee R, Debattista K, Bashford-Rogers T, et al. Objective and subjective evaluation of high dynamic range video com-pression [J]. Signal Processing: Image Communication, 2016, 47: 426–437. doi: 10.1016/j.image.2016.08.001
[19] Liu Yu, Liu Shuping, Wang Zengfu. A general framework for image fusion based on multi-scale transform and sparse representation [J]. Information Fusion, 2015, 24: 147–164. doi: 10.1016/j.inffus.2014.09.004
[20] Jagalingam P, Hegde A V. A Review of quality metrics for fused image [J]. Aquatic Procedia, 2015, 4: 133–142. doi: 10.1016/j.aqpro.2015.02.019
[21] 张小利, 李雄飞, 李军.融合图像质量评价指标的相关性分析及性能评估[J].自动化学报, 2014, 40(2): 306–315. http://www.oalib.com/paper/4417947
Zhang Xiaoli, LI Xiongfei, LI Jun. Validation and correlation analysis of metrics for evaluating performance of image fusion[J]. Acta Automatica Sinica, 2014, 40(2): 306–315. http://www.oalib.com/paper/4417947
[22] Han Yu, Cai Yunze, Cao Yin, et al. A new image fusion performance metric based on visual information fidelity[J]. Information Fusion, 2013, 14(2): 127–135. doi: 10.1016/j.inffus.2011.08.002
[23] Warne R T. Testing Spearman's hypothesis with advanced placement examination data[J]. Intelligence, 2016, 57: 87–95. doi: 10.1016/j.intell.2016.05.002
-
 点击扫一扫
点击扫一扫
图(5)
表(5)
计量
- 文章访问数: 6452
- PDF下载数: 3499
- 施引文献: 0


