
 E-mail Alert
 RSS
RSS
| Citation: |

|
Resolution improvement for SD-OCT system based on Zemax
-
Abstract
The design and optimization for lens group in spectral domain optical coherence tomography (SD-OCT) system is fairly important to improve the imaging quality. The field lens in sample arm and the focusing lens in spectrometer are designed based on Zemax, and the imaging quality is evaluated according to spot diagram and wavefront map. The results show that the field lens can provide ideal imaging quality and good lateral resolution. And the focusing lens in the spectrometer makes the size of focal spot smaller than the pixel width of CCD to avoid the interference in each pixel of CCD. In this way, we observe considerable improvement in the resolution of the spectrometer.-
Keywords:
- Zemax /
- SD-OCT /
- resolution /
- optimization
-

-
References
[1] Huang D, Swanson E A, Lin C P, et al. Optical coherence tomography[J]. Science, 1991, 254(5035): 1178–1181. doi: 10.1126/science.1957169 [2] Clivaz X, Marquis-Weible F, Salathé R P, et al. High-resolution reflectometry in biological tissues[J].Optics Letters, 1992, 17(1): 4–6. doi: 10.1364/OL.17.000004 [3] Puliafito C A, Lin C P, Huang D, et al. High-speed optical coherence domain reflectometry[J]. Optics Letters, 1992, 17(2):151–153. doi: 10.1364/OL.17.000151 [4] H Hue C, Le Cadre J P, Perez P. Tracking multiple objects with particle filtering[J]. IEEE Transactions on Aerospace and Electronic Systems, 2006, 38(3): 791–812. [5] Wang J H, Wang M R. System and method for improving image quality in vivo OCT imaging: US2012/065991[P]. 2013-06-06. [6] Peng X, Yang S Z, Yu B, et al. Continuous imaging of the blood vessels in tumor mouse dorsal skin window chamber model by using SD-OCT[J]. Proceedings of SPIE, 2016, 9697: 96973N. doi: 10.1117/12.2213134 [7] Jiang H, Abukhalil F, Shen M, et al. Slit-lamp-adapted ultra-high resolution OCT for imaging the posterior segment of the eye[J]. Ophthalmic Surgery, Lasers and Imaging Retina, 2016, 43(1): 76–81. [8] 周新. 光学相干层析成像横向扫描系统及外触发模式研究[D]. 浙江大学, 2007. [9] 王毅. 谱域OCT多通道光栅光谱仪研究[D]. 中国计量学院, 2016. [10] 曹跃祖, 田益民, 李福芸.圆孔衍射与瑞利判据的可视化研究[J].北京印刷学院学报, 2015(6): 61–64. -
Overview

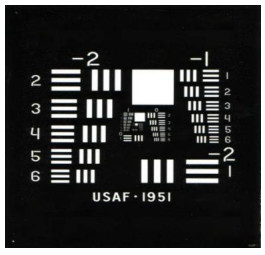
Spectral domain optical coherence tomography (SD-OCT) is a non-invasive cross-sectional imaging methodthat has been developed to obtain high-resolution tomographic images of biological, organic and inorganic objects. Thehigh resolution, imaging depth, acquisition speed, and sensitivity of the SD-OCT system are significant for medical imaging. However, there are many negative factors which will result in lower system resolution. For example, if the fieldlens in sample arm is not appropriate, the lateral resolution will decrease. Similarly, if the focusing lens in spectrometercannot provide the focal spot with a smaller size comparing with the pixel width of CCD, it will bring interference ineach pixel of CCD, and the resolution of the spectrometer will decrease. As a result, the design and optimization for lensgroup in SD-OCT system are fairly important to the resolution and imaging quality. The aim of this study is to providehigher resolution of the system by designing and optimizing the lens group in sample arm and spectrometer based onZemax, which can provide the optical designer with spot diagram, geometric aberration, optical transfer function andother means of analysis used to assess the imaging quality. The field lens in sample arm and the focusing lens in spectrometer are designed, and the imaging quality is evaluated according to spot diagram and wavefront map. The resultsindicate that the field lens can bring ideal lateral resolution of 7.9 μm, which is sufficient for high-resolution imaging.And the focusing lens in the spectrometer makes the size of focal spot smaller than the pixel width of CCD to avoid theinterference in each pixel of CCD. In this way, we observe considerable improvement in the resolution of the spectrometer, and the signal-to-noise ratio of the system is improved, too. After design and optimization with Zemax, we measuredthe lateral resolution of the system with the USAF1951 resolution board. The results show that the lateral resolution is 12μm, which differs from the simulation value by 5.1 microns. Then we calculate the resolution of the spectrometer withthe focusing lens we designed. It turns out that the resolution of the spectrometer determined by the pixel width of CCDis 0.0363 nm. In conclusion, the simulation results, experimental results and calculation results show that the lens groupwe designed can achieve good resolution and imaging quality, and provide a strong theoretical basis for the processing ofthe device.
-
Access History

Export File
Citation
Format
Content
 DownLoad:

-
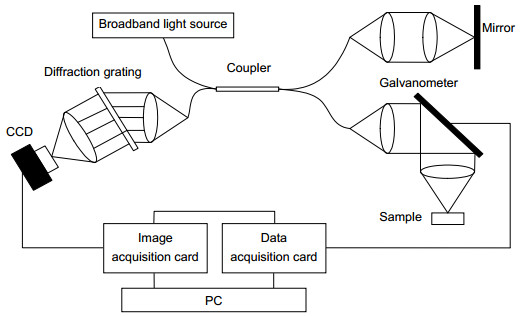
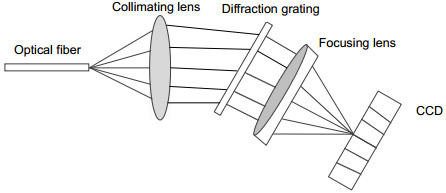
Figure 1.
Schematic diagram of the SD-OCT system configuration
-
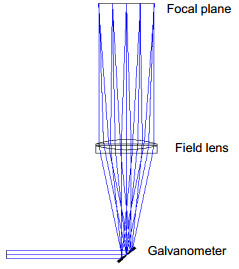
Figure 2.
3D-layout of sample arm by Zemax.
-
Figure 3.
Parameter of the lens after optimization.
-
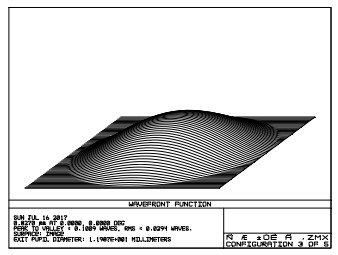
Figure 4.
Wavefront map of the system after optimization.
-
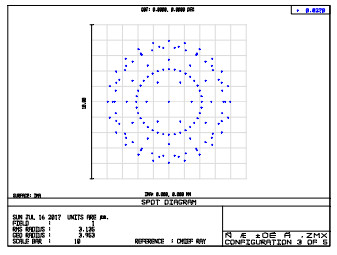
Figure 5.
Spot diagram of the system after optimization.
-
Figure 6.
Structure of the spectrometer.
-
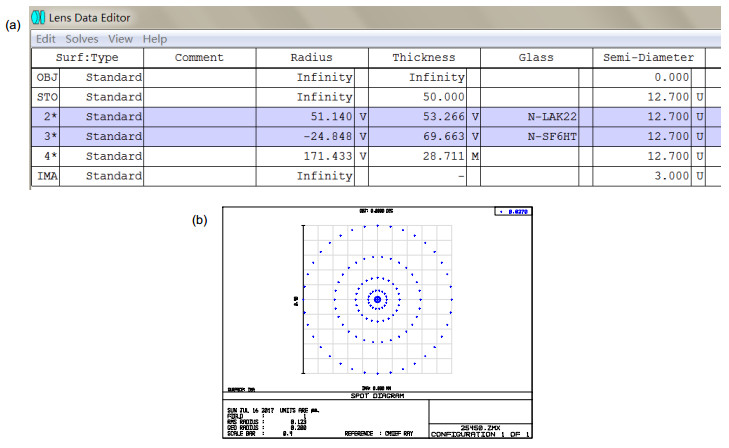
Figure 7.
Parameter of the focusing lens and size of the focusing spot after optimization. (a) Parameter of the focusing lens after optimization. (b) Size of the focusing spot after optimization.
-
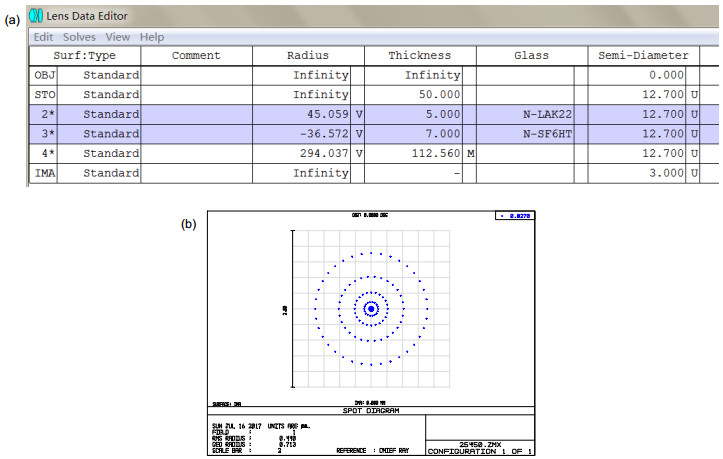
Figure 8.
Parameter of the focusing lens and size of the focusing spot after further optimization. (a) Parameter of the focusing lens after further optimization. (b) Size of the focusing spot after further optimization.
-
Figure 9.
Practicality picture of the resolution board.
-
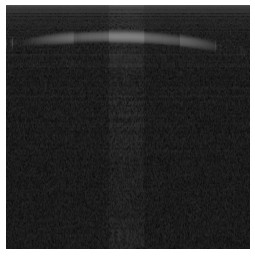
Figure 10.
Image of the resolution board.


