
 E-mail Alert
 RSS
RSS
| Citation: |
He Jintao, Chen Minghui, Jia Wenyu, et al. Segmentation of diabetic macular edema in OCT retinal images[J]. Opto-Electronic Engineering, 2018, 45(7): 170605. doi: 10.12086/oee.2018.170605

|
Segmentation of diabetic macular edema in OCT retinal images
-
Abstract
Diabetic macular edema (DME) is one of the important reasons leading to blindness. Its pathological features are mainly manifested in the accumulation of fluid in the retina. A method for segmentation of diabetic macular edema in optical coherence tomography (OCT) retinal images is proposed. Firstly, through the image preprocessing, we exclude the impact of speckle noise and blood vessels on the final segmentation results. We used the improved level set method to solve the problem of segmentation effectively and calculated the area of edema area, which provides quantitative analytic tools for clinical diagnosis and therapy. Finally, we validated the method in this study on 15 OCT retina images with DME adults. The precision, sensitivity and dice similarity coefficient (DSC) for DME segmentation are 81.12%, 86.90% and 80.05%, respectively. -

-
References
[1] Raja D, Sultana B. Health education to prevent age-related macular degeneration in the us population[C]//ASME 2015 International Mechanical Engineering Congress and Exposition. Houston, Texas, USA, 2015: 805-812. [2] Pelosini L, Hull C C, Boyce J F, et al. Optical coherence tomography may be used to predict visual acuity in patients with macular edema[J]. Investigative Ophthalmology & Visual Science, 2011, 52(5): 2741-2748. [3] Wilkins G R, Houghton O M, Oldenburg A L. Automated segmentation of intraretinal cystoid fluid in optical coherence tomography[J]. IEEE Transactions on Biomedical Engineering, 2012, 59(4): 1109-1114. doi: 10.1109/TBME.2012.2184759 [4] de Sisternes L, Jonna G, Moss J, et al. Automated intraretinal segmentation of SD-OCT images in normal and age-related macular degeneration eyes[J]. Biomedical Optics Express, 2017, 8(3): 1926-1949. doi: 10.1364/BOE.8.001926 [5] Zhang M, Wang J, Pechauer A D, et al. Advanced image processing for optical coherence tomographic angiography of macular diseases[J]. Biomedical Optics Express, 2015, 6(12): 4661-4675. doi: 10.1364/BOE.6.004661 [6] Sanchez J I, Ascaso F J, Perez I, et al. Role of SD-OCT in the follow-up of a patient with macular edema associated with mucopoysaccharidosis type Ⅱ (Hunter syndrome) undergoing idursulfase enzyme replacement therapy[J]. Acta Ophthalmologica, 2015, 93(S255): 255. [7] 吕卫, 翟庆伟, 褚晶辉, 等.彩色眼底图像糖网渗出物的自动检测[J].光电工程, 2016, 43(12): 183-192, 199. Lü W, Zhai Q W, Chu J H, et al. Automated detection of diabetic retinopathy exudates in color fundus images[J]. Opto-Electronic Engineering, 2016, 43(12): 183-192, 199. [8] Fernandez D C. Delineating fluid-filled region boundaries in optical coherence tomography images of the retina[J]. IEEE Transactions on Medical Imaging, 2005, 24(8): 929-945. doi: 10.1109/TMI.2005.848655 [9] Gonzalez A, Remeseiro B, Ortega M, et al. Automatic cyst detection in OCT retinal images combining region flooding and texture analysis[C]//Proceedings of the 26th IEEE International Symposium on Computer-Based Medical Systems. Porto, 2013: 397-400. [10] Zheng Y L, Sahni J, Campa C, et al. Computerized assessment of intraretinal and subretinal fluid regions in spectral-domain optical coherence tomography images of the retina[J]. American Journal of Ophthalmology, 2013, 155(2): 277-286. doi: 10.1016/j.ajo.2012.07.030 [11] Chen X J, Niemeijer M, Zhang L, et al. Three-dimensional segmentation of fluid-associated abnormalities in retinal OCT: probability constrained graph-search-graph-cut[J]. IEEE Transactions on Medical Imaging, 2012, 31(8): 1521-1531. doi: 10.1109/TMI.2012.2191302 [12] Bogunović H, Abràmoff MD, Sonka M. Geodesic graph cut based retinal fluid segmentation in optical coherence tomography[C]//Proceedings of the Ophthalmic Medical Image Analysis Second International Workshop. Munich, 2015: 49-56. [13] Srinivasan P P, Kim L A, Mettu P S. Fully automated detection of diabetic macular edema and dry age-related macular degeneration from optical coherence tomography images[J]. Biomedical Optics Express, 2014, 5(10): 3568-3577. doi: 10.1364/BOE.5.003568 [14] Lang A, Carass A, Swingle E K, et al. Automatic segmentation of microcystic macular edema in OCT[J]. Biomedical Optics Express, 2014, 6(1): 155-169. [15] Perona P, Malik J. Scale-Space and Edge Detection Using Anisotropic Diffusion[J]. IEEE Transactions on Pattern Analysis and Machine Intelligence, 1990, 12(7): 629-639. doi: 10.1109/34.56205 [16] Li C M, Kao C Y, Gore J C, et al. Implicit active contours driven by local binary fitting energy[C]//Proceedings of the Conference on Computer Vision and Pattern Recognition. Minneapolis, 2007: 1-7. [17] Nguyen N T, Bui T D. Automated posture segmentation in continuous finger spelling recognition[C]//Proceedings of the 3rd International Conference on Human-Centric Computing. Cebu, 2010: 1-5. [18] Trabelsi H, Zghal I, Slokom N. Segmentation of cyctoids macular edema in optical cohenrence tomography[C]//Proceedings of the 2nd International Conference on Advanced Technologies for Signal and Image Processing. Monastir, 2016: 303-306. [19] Udupa J K, Leblanc V R, Zhuge Y, et al. A framework for evaluating image segmentation algorithms[J]. Computerized Medical Imaging and Graphics, 2006, 30(2): 75-87. doi: 10.1016/j.compmedimag.2005.12.001 -
Overview

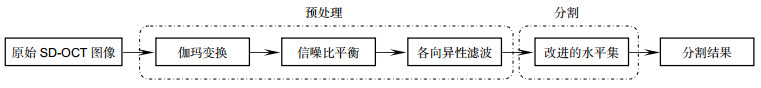
Overview: Diabetic macular edema (DME) is one of the important reasons leading to blindness, and the incidence of diabetic retinopathy is usually associated with macular edema symptoms. Its pathological features are mainly manifested in the accumulation of fluid in the retina. The ophthalmologist could identify and diagnosis the cystoids edema in the optical coherence tomography (OCT) image, but it is time-consuming and labor intensive. Furthermore, it is necessary to manually mark each slice of the OCT images if the ophthalmologist wants to quantify the cystic edema. Thus, an automated algorithm is proposed to enable automatic segmentation of cystoids edema and to provide an area of cystic edema in the slice to estimate the volume. The method is divided into two steps of preprocessing and segmentation. The first step, preprocessing, we should eliminate the difference in signal-to-noise of the images. A variety of reasons would result in the difference between images, such as the images come from different patients. It would also result in intensity inhomogeneity of retinal OCT images. It would also lead to intensity inhomogeneity between each layer of the retinal in the images. Therefore, it is important to eliminate these effects. To prevent the interference of blood vessels leading to false detection, we use the gamma transformation to change the brightness, which not only removes the effects of the blood vessels but also retains the characteristics of the region of interest. For speckle noise, we remove the noise effectively by the anisotropic filtering method. We eliminate the noise of the retinal OCT images as well as preserve the edge information of each layer. The second step, segmentation, we extract the cystic edema area by improved level set function. Due to the distance regularizing term, the model is no re-initialization which overcoming the shortcomings of the traditional level set function allowing for flexible initialization of level set function. Another advantage of the method is that the Gaussian kernel function reduces the sensitivity to noise. Finally, we utilize the relationship between the number of pixels and the size of the image (an image region of 0.04 mm2 contains a set of 16 pixels×52 pixels), which calculated the area of the edema area in the OCT image quantitatively. Experiment result shows that the precision, sensitivity and dice similarity coefficient (DSC) for DME segmentation are 81.12%, 86.90% and 80.05%, respectively. It can be seen that the edema area can be divided effectively. The method provides quantitative analytic tools for clinical diagnosis and therapy.
-
Access History
Figures(4)
Tables(2)
Article Metrics
Export File
Citation
He Jintao, Chen Minghui, Jia Wenyu, et al. Segmentation of diabetic macular edema in OCT retinal images[J]. Opto-Electronic Engineering, 2018, 45(7): 170605. doi: 10.12086/oee.2018.170605
Format
Content
 DownLoad:
-
Figure 1.
The flowchart of the proposed method
-
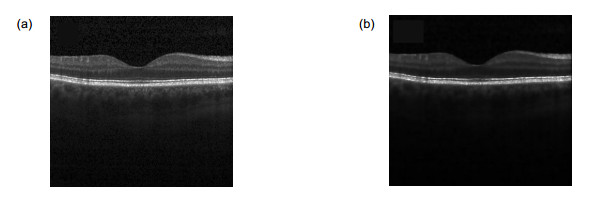
Figure 2.
The filtered OCT B-scan image
-
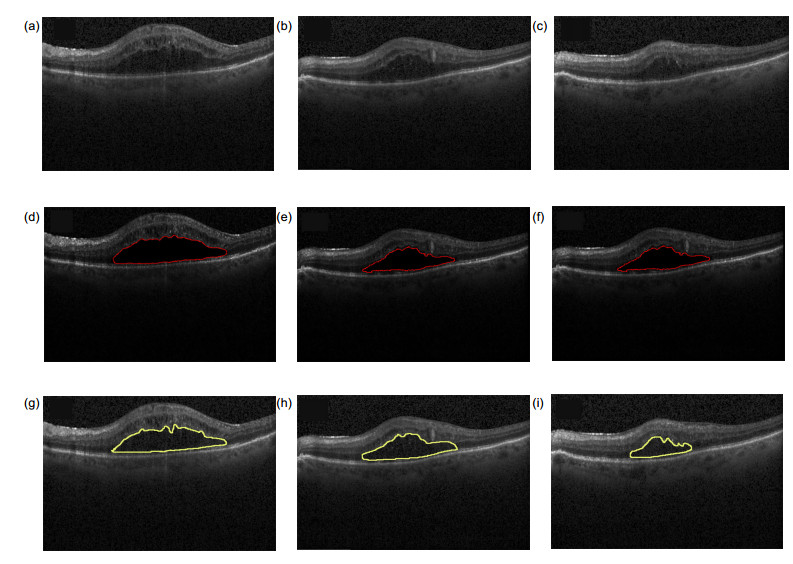
Figure 3.
Randomly selected slice of OCT images
-
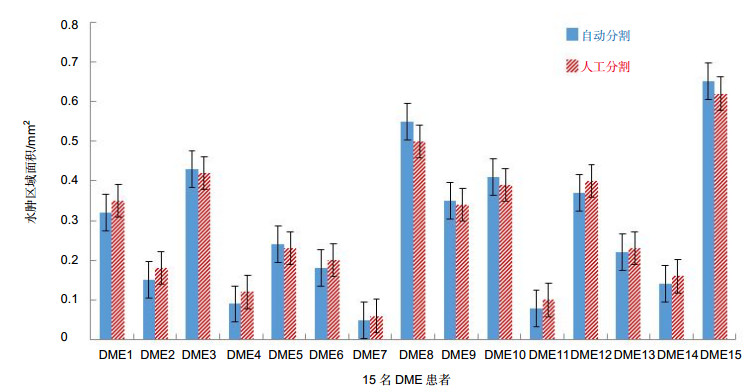
Figure 4.
Comparison of the calculated area of liquid from the manual and the automatic algorithm


