
 E-mail Alert
 RSS
RSS
| Citation: |
Ouyang Y X, Fu X, Duan F J, et al. Spectral reduction algorithm for echelle grating spectrometer based on least-squares image coordinate correction[J]. Opto-Electron Eng, 2024, 51(7): 240134. doi: 10.12086/oee.2024.240134

|
Spectral reduction algorithm for echelle grating spectrometer based on least-squares image coordinate correction
-
Abstract
The echelle grating spectrometer has cross-dispersion characteristics, and two-dimensional spectral map reduction is the key link to determine its wavelength measurement accuracy, but the changes of spot coordinates caused by environmental changes, processing and mounting have a serious impact on the accuracy of spectral map reduction. In this paper, a spectrum reduction algorithm based on least-squares image coordinate correction is proposed for the middle-step spectrometer. Firstly, the center-of-mass coordinates of the multi-wavelength spot of the calibrated mercury lamp light source are extracted, and the coefficient matrix is constructed by using the theoretical and actual image point coordinates. The translation, scaling, and rotating coefficients of the two-dimensional image plane are obtained by the least-squares estimation method, and then a polynomial fitting is adopted to reduce the influence of residuals, to achieve the correction of the image coordinates of the spot at different wavelengths, and then achieve the accurate resolution of wavelength, and realize the wavelength accurate solving. The experimental results show that the algorithm can effectively improve the spectral image reduction accuracy of the middle-step spectrometer, and the deviation of the corrected coordinates from the ideal coordinates is less than 0.6 image element under the condition of simulating larger mounting errors, which proves that the algorithm has high accuracy. -

-
References
[1] Keliher P N, Wohlers C C. Echelle grating spectrometers in analytical spectrometry[J]. Anal Chem, 1976, 48(3): 333A−340A. doi: 10.1021/ac60367a782 [2] Ma K Q, Chen K X, Zhu N, et al. High-resolution compact on-chip spectrometer based on an echelle grating with densely packed waveguide array[J]. IEEE Photonics J, 2019, 11(1): 4900107. doi: 10.1109/JPHOT.2018.2888592 [3] García M, Aguirre M A, Canals A. A new multinebulizer for spectrochemical analysis: wear metal determination in used lubricating oils by on-line standard dilution analysis (SDA) using inductively coupled plasma optical emission spectrometry (ICP OES)[J]. J Anal At Spectrom, 2020, 35(2): 265−272. doi: 10.1039/C9JA00255C [4] Cahyadi D, Susilowati E, Arsyansyah M, et al. Development of a rapid-test method for the determination of calcium, zinc, phosphorus, and sulfur in automotive engine oil by WD-XRF (wavelength dispersive x-ray fluorescent)[J]. IOP Conf Ser Mater Sci Eng, 2020, 980: 012050. doi: 10.1088/1757-899X/980/1/012050 [5] Amais R S, Amaral C D B, Fialho L L, et al. Determination of P, S and Si in biodiesel, diesel and lubricating oil using ICP-MS/MS[J]. Anal Methods, 2014, 6(13): 4516−4520. doi: 10.1039/C4AY00279B [6] Li H L, Wang H B, Huang Y C, et al. Plasma characteristics and quantitative analysis of Pb and Ni in soil based on LIBS technology[J]. Optoelectron Lett, 2020, 16(2): 143−148. doi: 10.1007/s11801-020-9189-8 [7] Vinić M, Aruffo E, Andreoli F, et al. Quantification of heavy metals in oils with µL volume by laser induced breakdown spectroscopy and minimazing of the matrix effect[J]. Spectrochim Acta Part B At Spectrosc, 2020, 164: 105765. doi: 10.1016/j.sab.2020.105765 [8] Nevejans D, Neefs E, Van Ransbeeck E, et al. Compact high-resolution spaceborne echelle grating spectrometer with acousto-optical tunable filter based order sorting for the infrared domain from 2.2 to 4.3 μm[J]. Appl Opt, 2006, 45(21): 5191−5206. doi: 10.1364/AO.45.005191 [9] 崔涛, 尹禄, 梁培, 等. 中阶梯光栅光谱仪谱图还原技术发展与展望(特邀)[J]. 激光与光电子学进展, 2024, 61(3): 0330003. doi: 10.3788/LOP231373 Cui T, Yin L, Liang P, et al. Development and prospects of spectral reduction technology of echelle spectrometer (Invited)[J]. Laser Optoelectron Prog, 2024, 61(3): 0330003. doi: 10.3788/LOP231373 [10] Liu K L, Hieftje G M. Investigation of wavelength calibration for an echelle cross-dispersion spectrometer[J]. J Anal At Spectrom, 2003, 18(10): 1177−1184. doi: 10.1039/b300981p [11] 宁春丽, 齐向东, 陈少杰, 等. 轻小型中阶梯光栅光谱仪光学设计及性能分析[J]. 光谱学与光谱分析, 2012, 32(12): 3406−3410. doi: 10.3964/j.issn.1000-0593(2012)12-3406-05 Ning C L, Qi X D, Chen S J, et al. Optical design and performance analysis of light and small echelle spectrograph[J]. Spectrosc Spectral Anal, 2012, 32(12): 3406−3410. doi: 10.3964/j.issn.1000-0593(2012)12-3406-05 [12] Finkelstein N A. The measurement of wavelength in echelle spectra[J]. J Opt Soc Am, 1953, 43(2): 90−96. doi: 10.1364/JOSA.43.000090 [13] McNeill J J. Wavelength measurement in echelle spectra[J]. J Opt Soc Am, 1959, 49(5): 441−444. doi: 10.1364/JOSA.49.000441 [14] 朱继伟, 孙慈, 杨晋, 等. 基于多项式拟合的中阶梯光栅光谱仪谱图还原[J]. 光学 精密工程, 2020, 28(8): 1627−1633. doi: 10.3788/OPE.20202808.1627 Zhu J W, Sun C, Yang J, et al. Spectrogram reduction for echelle grating spectrometer based on Polynomial fitting[J]. Opt Precis Eng, 2020, 28(8): 1627−1633. doi: 10.3788/OPE.20202808.1627 [15] 唐玉国, 陈少杰, 巴音贺希格, 等. 中阶梯光栅光谱仪的谱图还原与波长标定[J]. 光学 精密工程, 2010, 18(10): 2130−2136. doi: 10.3788/OPE.20101810.2130 Tang Y G, Chen S J, Bayanheshig, et al. Spectral reducing of cross-dispersed echelle spectrograph and its wavelength calibration[J]. Opt Precis Eng, 2010, 18(10): 2130−2136. doi: 10.3788/OPE.20101810.2130 [16] 傅骁. LIBS中阶梯光栅光谱仪实现技术及数据处理算法研究[D]. 天津: 天津大学, 2018. https://doi.org/10.27356/d.cnki.gtjdu.2018.000097. Fu X. Implementation of LIBS echelle spectrometer and research on data processing method[D]. Tianjin: Tianjin University, 2018. https://doi.org/10.27356/d.cnki.gtjdu.2018.000097. [17] 崔涛, 尹禄, 孙亚楠, 等. 基于全像面拟合的中阶梯光栅光谱仪谱图还原算法[J]. 中国激光, 2024, 51(8): 0811003. doi: 10.3788/CJL231469 Cui T, Yin L, Sun Y N, et al. Spectral reduction algorithm for echelle spectrometer based on full-field fitting[J]. Chin J Lasers, 2024, 51(8): 0811003. doi: 10.3788/CJL231469 [18] 郑麒麟, 文龙, 陈沁. 基于散斑检测的微型计算光谱仪研究进展[J]. 光电工程, 2021, 48(3): 200183. doi: 10.12086/oee.2021.200183 Zheng Q L, Wen L, Chen Q. Research progress of computational microspectrometer based on speckle inspection[J]. Opto-Electron Eng, 2021, 48(3): 200183. doi: 10.12086/oee.2021.200183 [19] Zheng Z H, Zhu S K, Chen Y, et al. Towards integrated mode-division demultiplexing spectrometer by deep learning[J]. Opto-Electron Sci, 2022, 1(11): 220012. doi: 10.29026/oes.2022.220012 [20] 王玉, 曾延安, 郑海霆, 等. 基于成像光谱仪的光亮度精确测量方法研究[J]. 激光技术, 2024, 48(2): 166−170. doi: 10.7510/jgjs.issn.1001-3806.2024.02.004 Wang Y, Zeng Y A, Zheng H T, et al. Study on luminance accurate measurement method based on imaging spectrometer[J]. Laser Technol, 2024, 48(2): 166−170. doi: 10.7510/jgjs.issn.1001-3806.2024.02.004 -
Overview
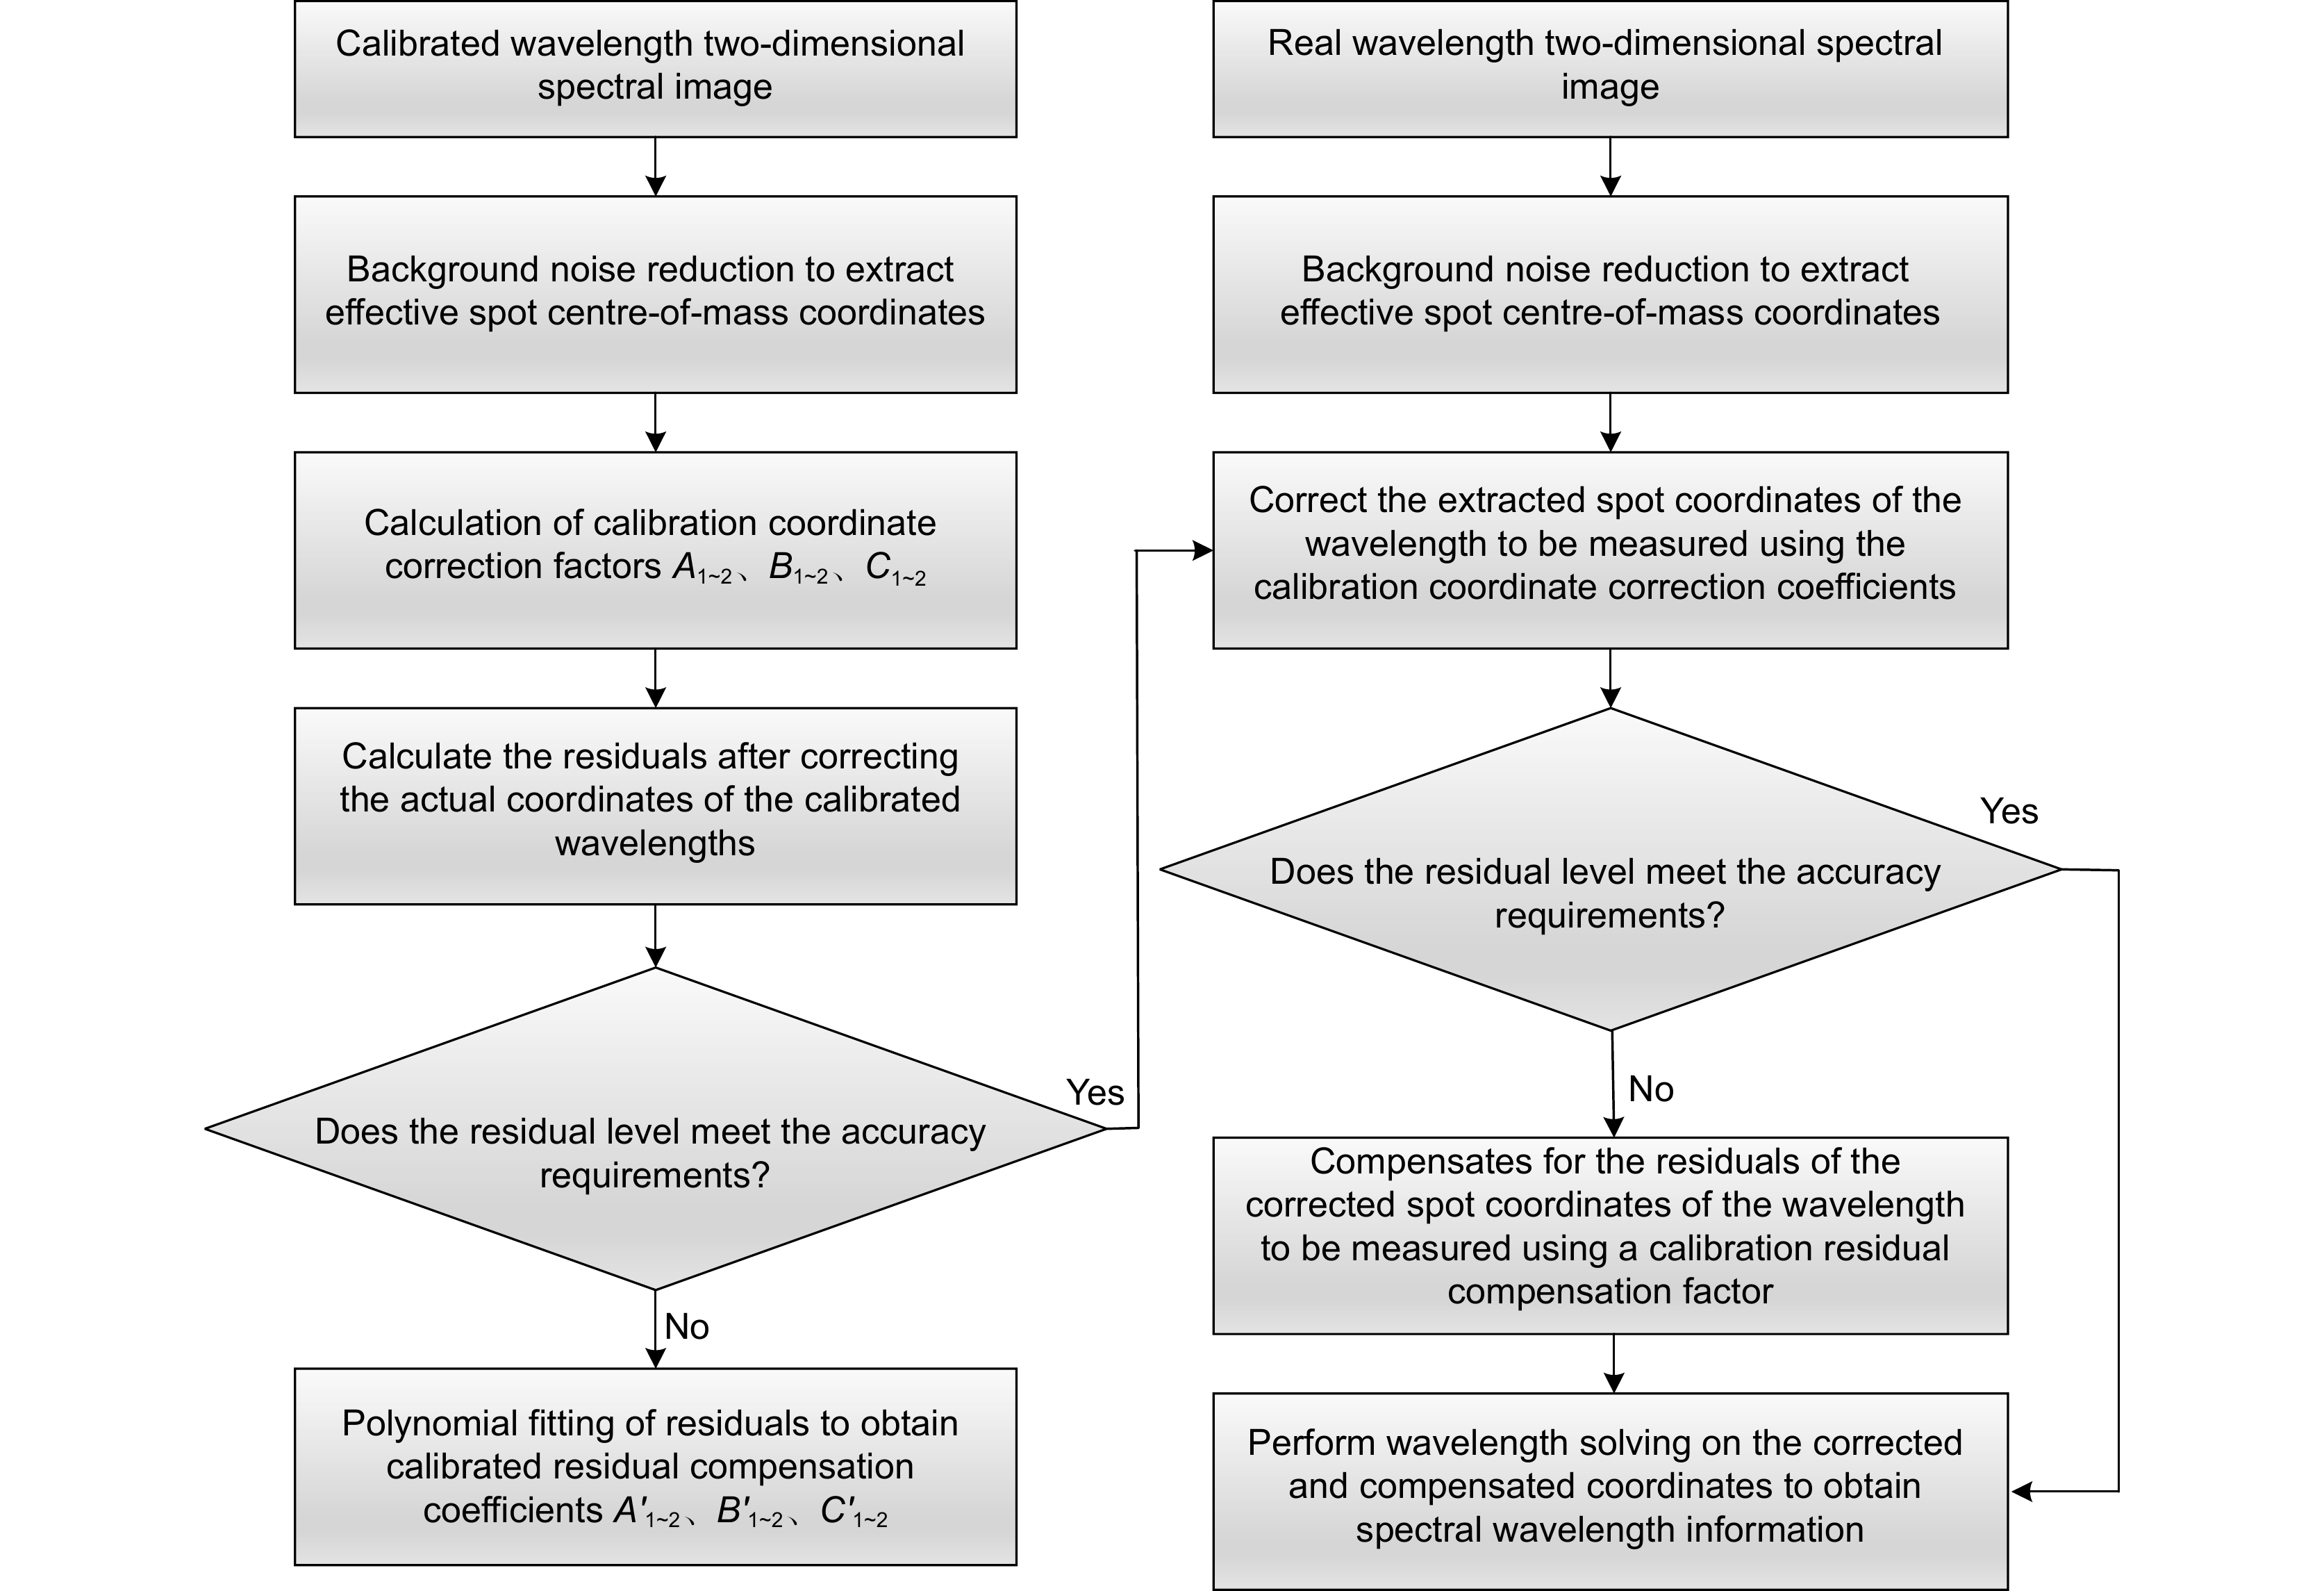
Echelle grating spectrometer uses a cross-dispersive optical structure for spectroscopy, forming a two-dimensional spectral image on the image plane. The reduction accuracy of the two-dimensional spectral image is to determine the accuracy of its wavelength measurement, but environmental changes, processing and mounting and other reasons will lead to the error between the actual spot coordinates and the theoretical spot coordinates, and the change of the spot coordinates will have a serious impact on the reduction accuracy of the spectral image. In this paper, a spectrum reduction algorithm for an echelle grating spectrometer based on least squares image coordinate correction is proposed. Firstly, the theoretical spot coordinates of the mercury lamp are recorded by simulation software, and then measurements are made using a calibrated mercury lamp light source, and the background noise reduction and morphological processing of the two-dimensional spectral map are carried out to obtain the center-of-mass coordinates of the actual spot of the wavelength of the mercury lamp, and then the coefficient matrix is constructed by utilizing the theoretical and actual image point coordinates, and then the coefficient matrix is solved from the obtained two-dimensional spectrum by the method of least squares. The coefficient matrix is solved by the least squares method to obtain the fitting coefficients of translation, scaling and rotation of the two-dimensional image plane, and then the polynomial fitting is used to reduce the influence of the residuals, realizing the image coordinate correction of the spot at different wavelengths, and then realize the accurate wavelength solution.
The experimental results show that the algorithm can effectively improve the spectral image reduction accuracy of the echelle grating spectrometer, and the center of mass extraction error is controlled at 0.6 image elements, and under the simulation of large mounting errors and environmental errors, the corrected coordinates of the measurements of the common elements deviate from their ideal coordinates by less than 0.6 image elements, which proves that the algorithm has high accuracy and provides a basis for the measurement of broad-band atomic emission spectra.
-
Access History

Figures(13)
Tables(7)
Article Metrics

Export File
Citation
Ouyang Y X, Fu X, Duan F J, et al. Spectral reduction algorithm for echelle grating spectrometer based on least-squares image coordinate correction[J]. Opto-Electron Eng, 2024, 51(7): 240134. doi: 10.12086/oee.2024.240134
Format
Content
 DownLoad:


-
Figure 1.
Schematic diagram of the echelle grating spectrometer
-
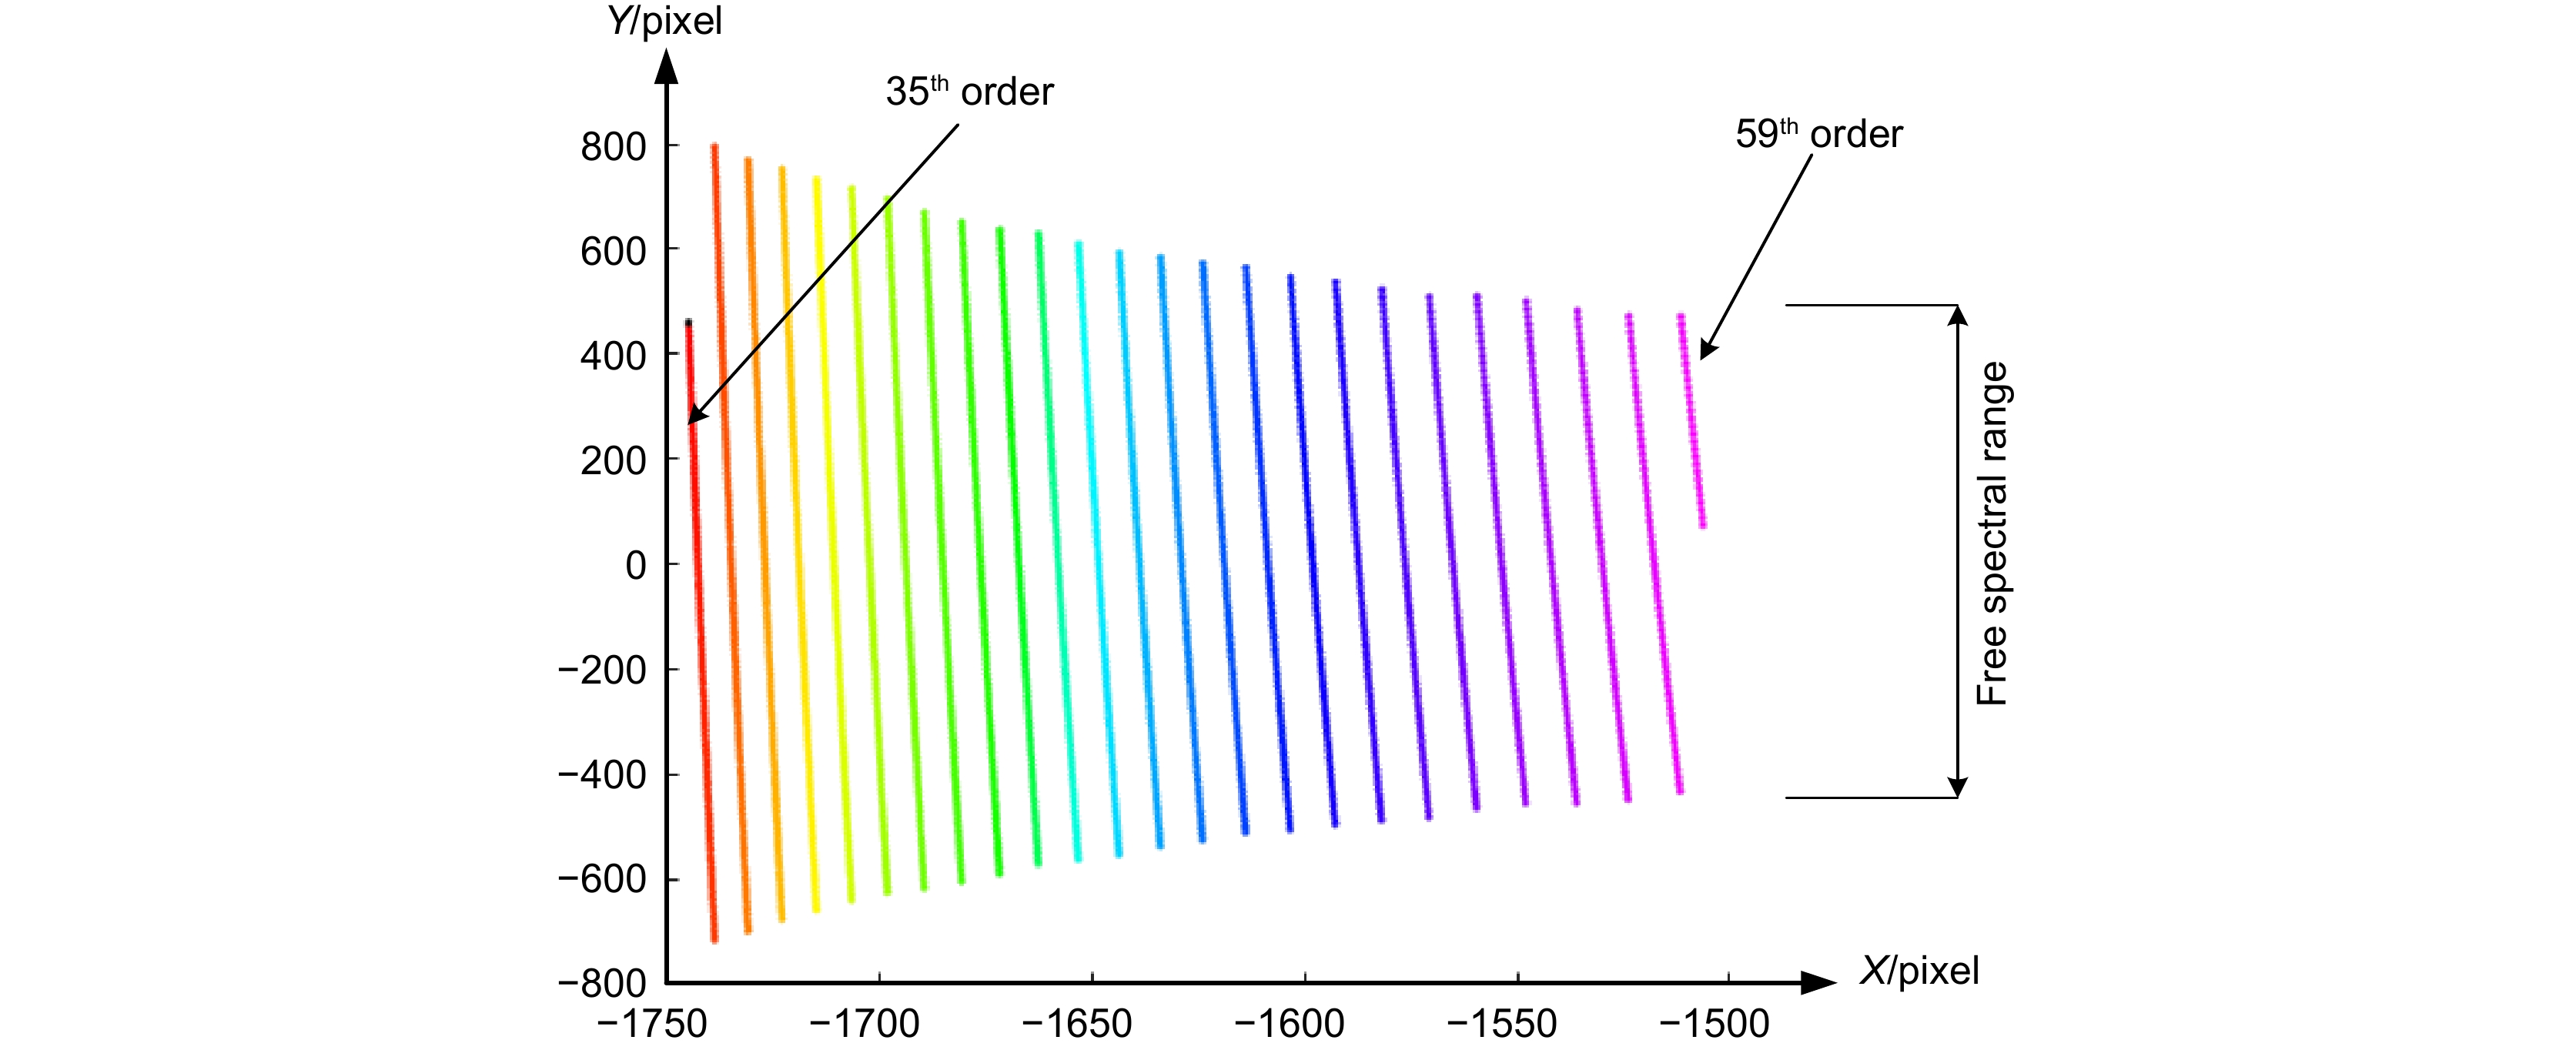
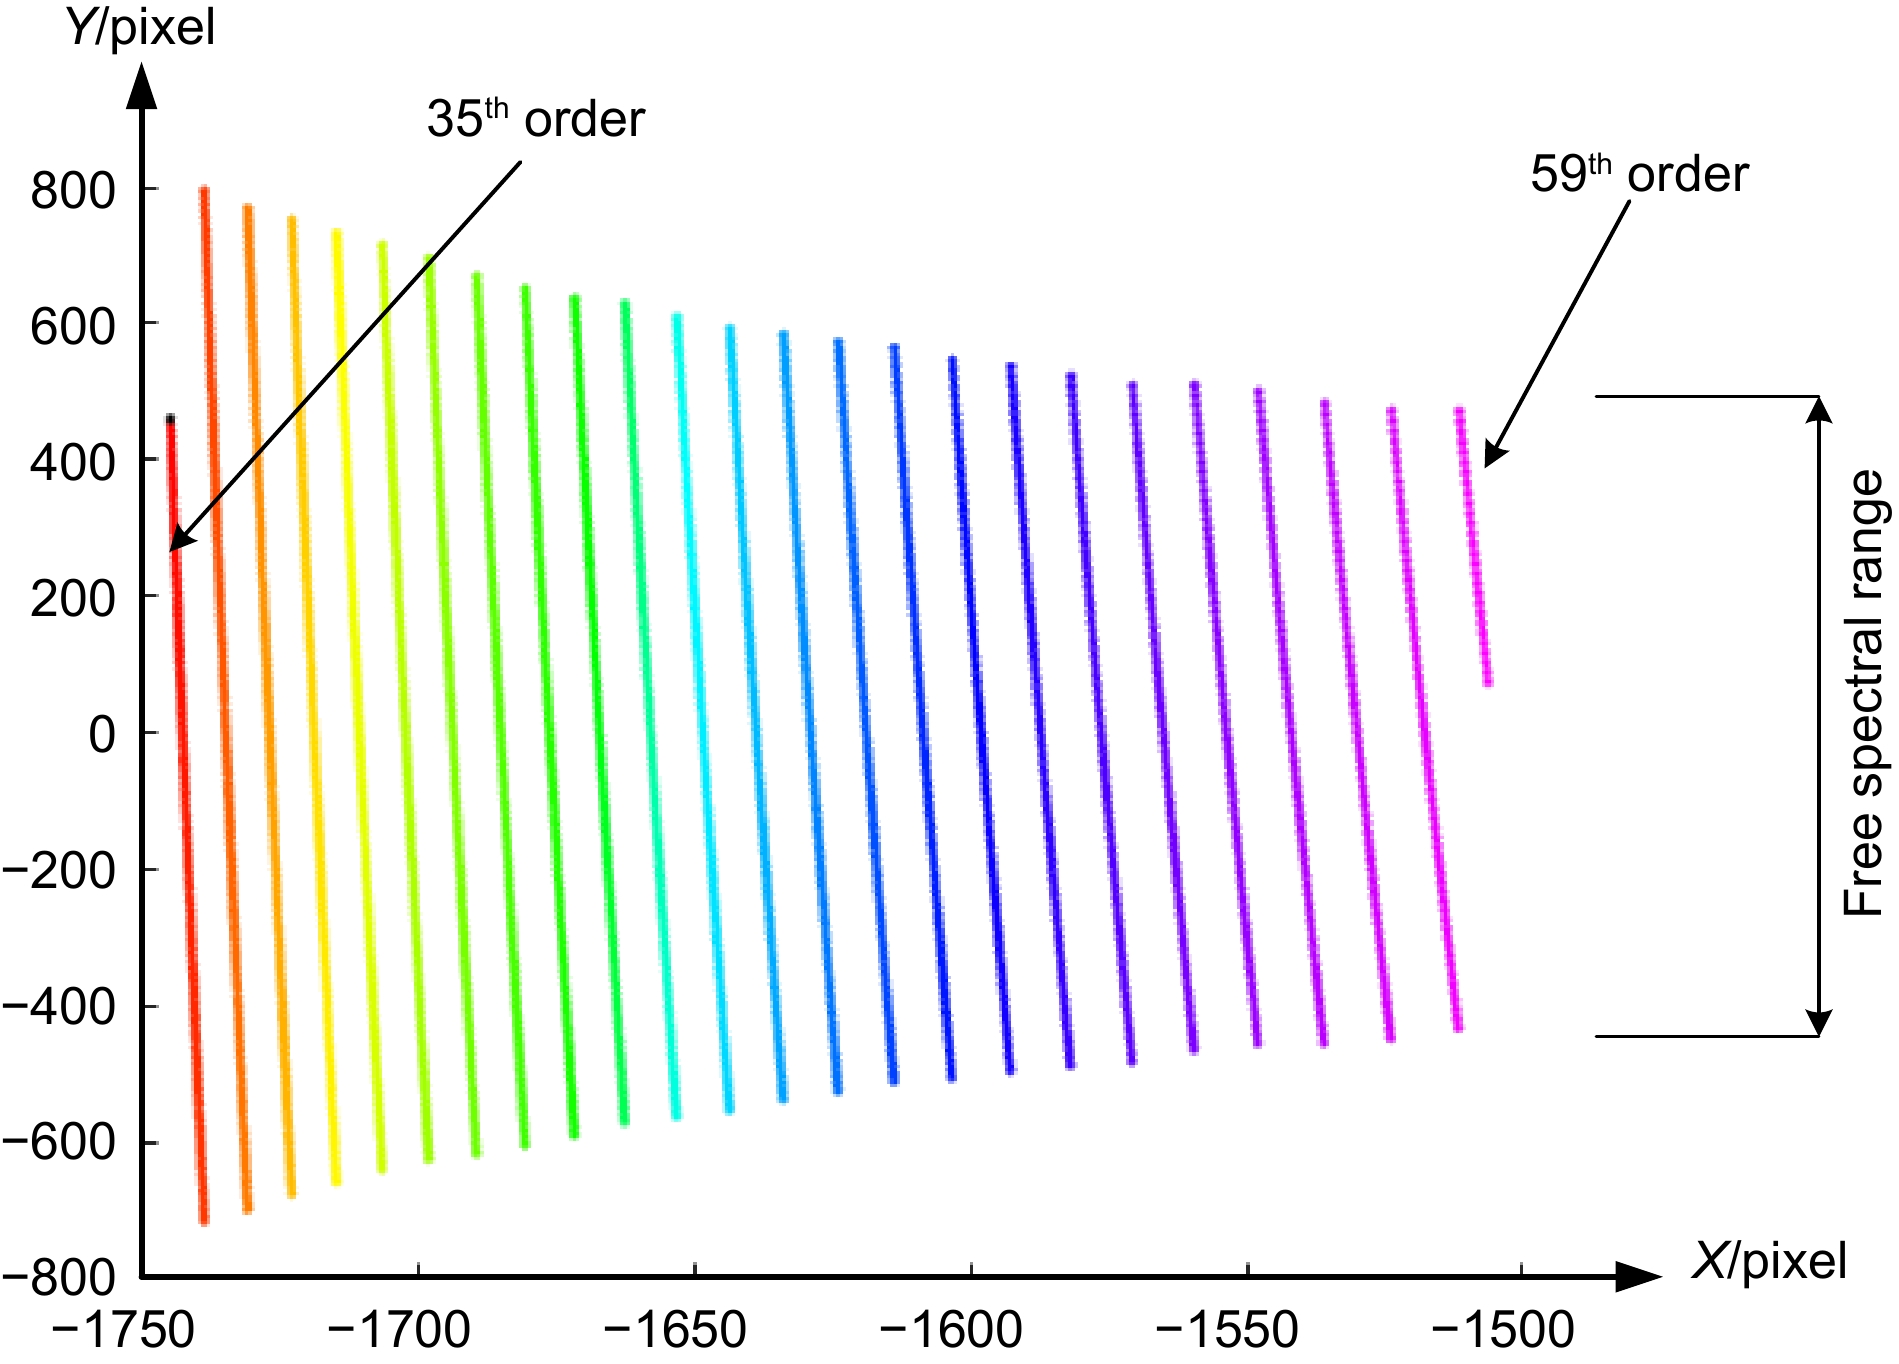
Figure 2.
Two-dimensional spectrogram of the echelle grating spectrometer in the free spectrum region
-
Figure 3.
Spectral reduction flowchart
-
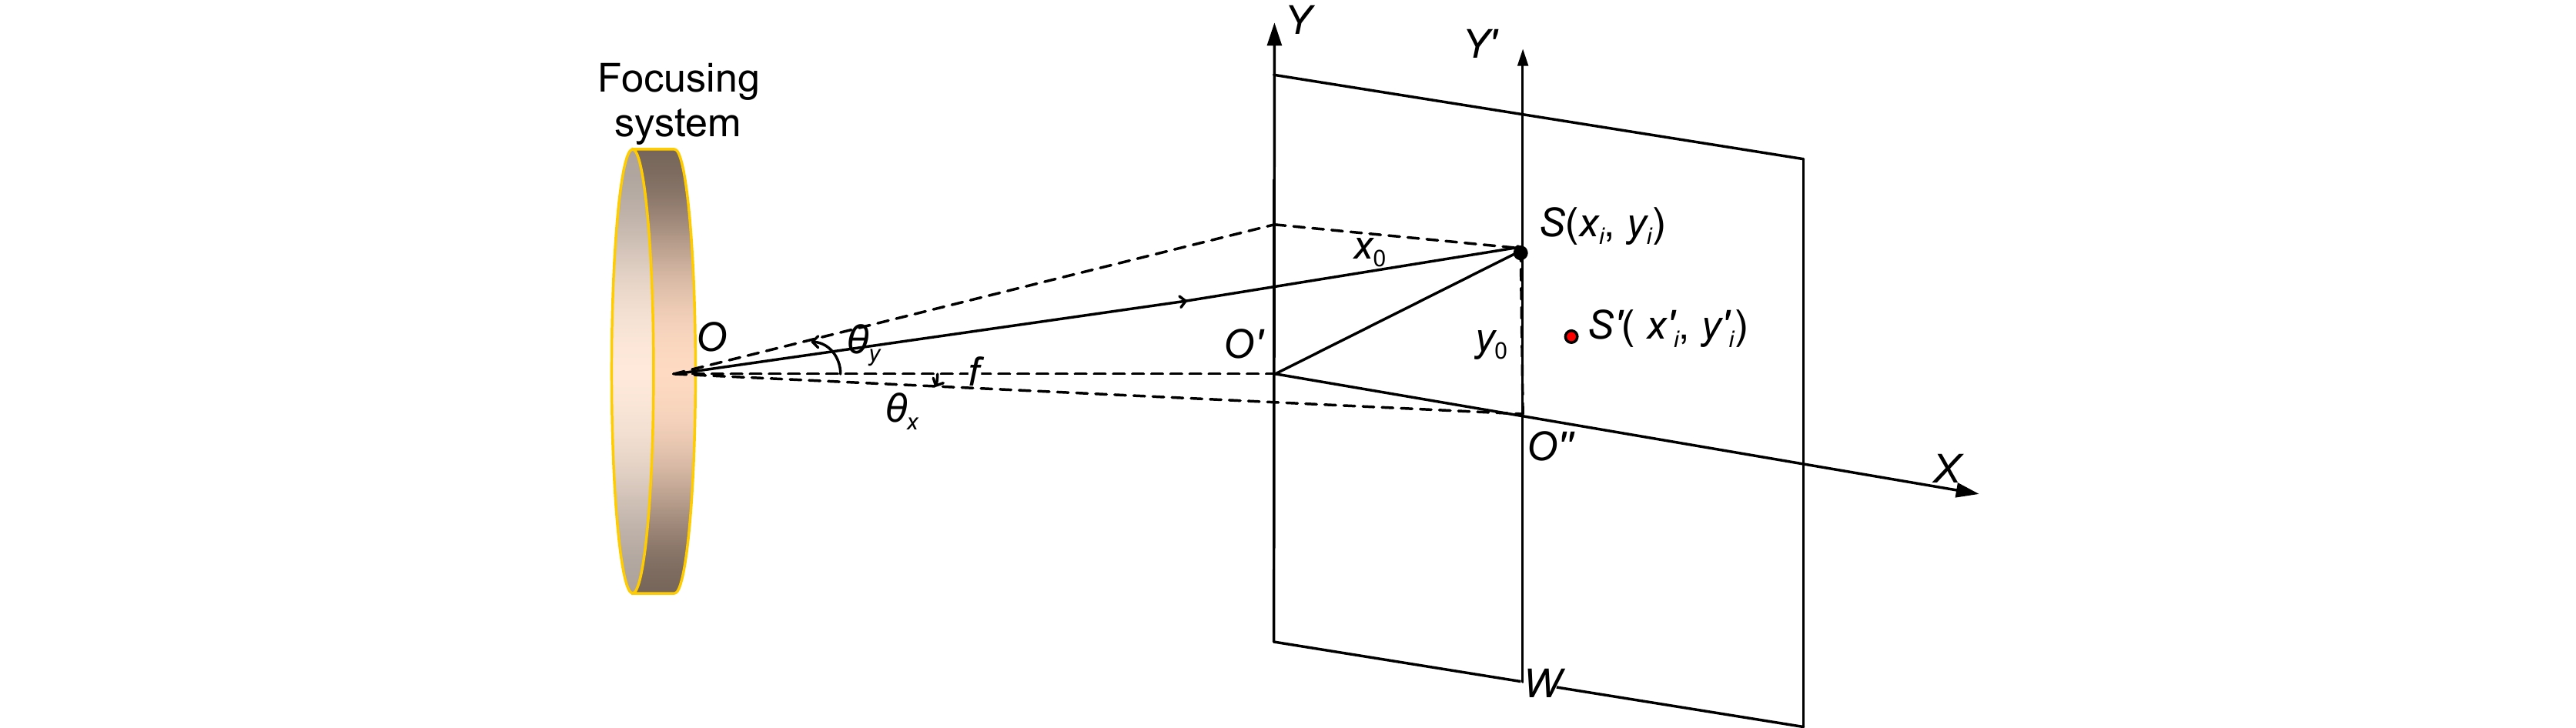
Figure 4.
Schematic diagram of the image plane spot
-
Figure 5.
Schematic of spectrogram reduction
-
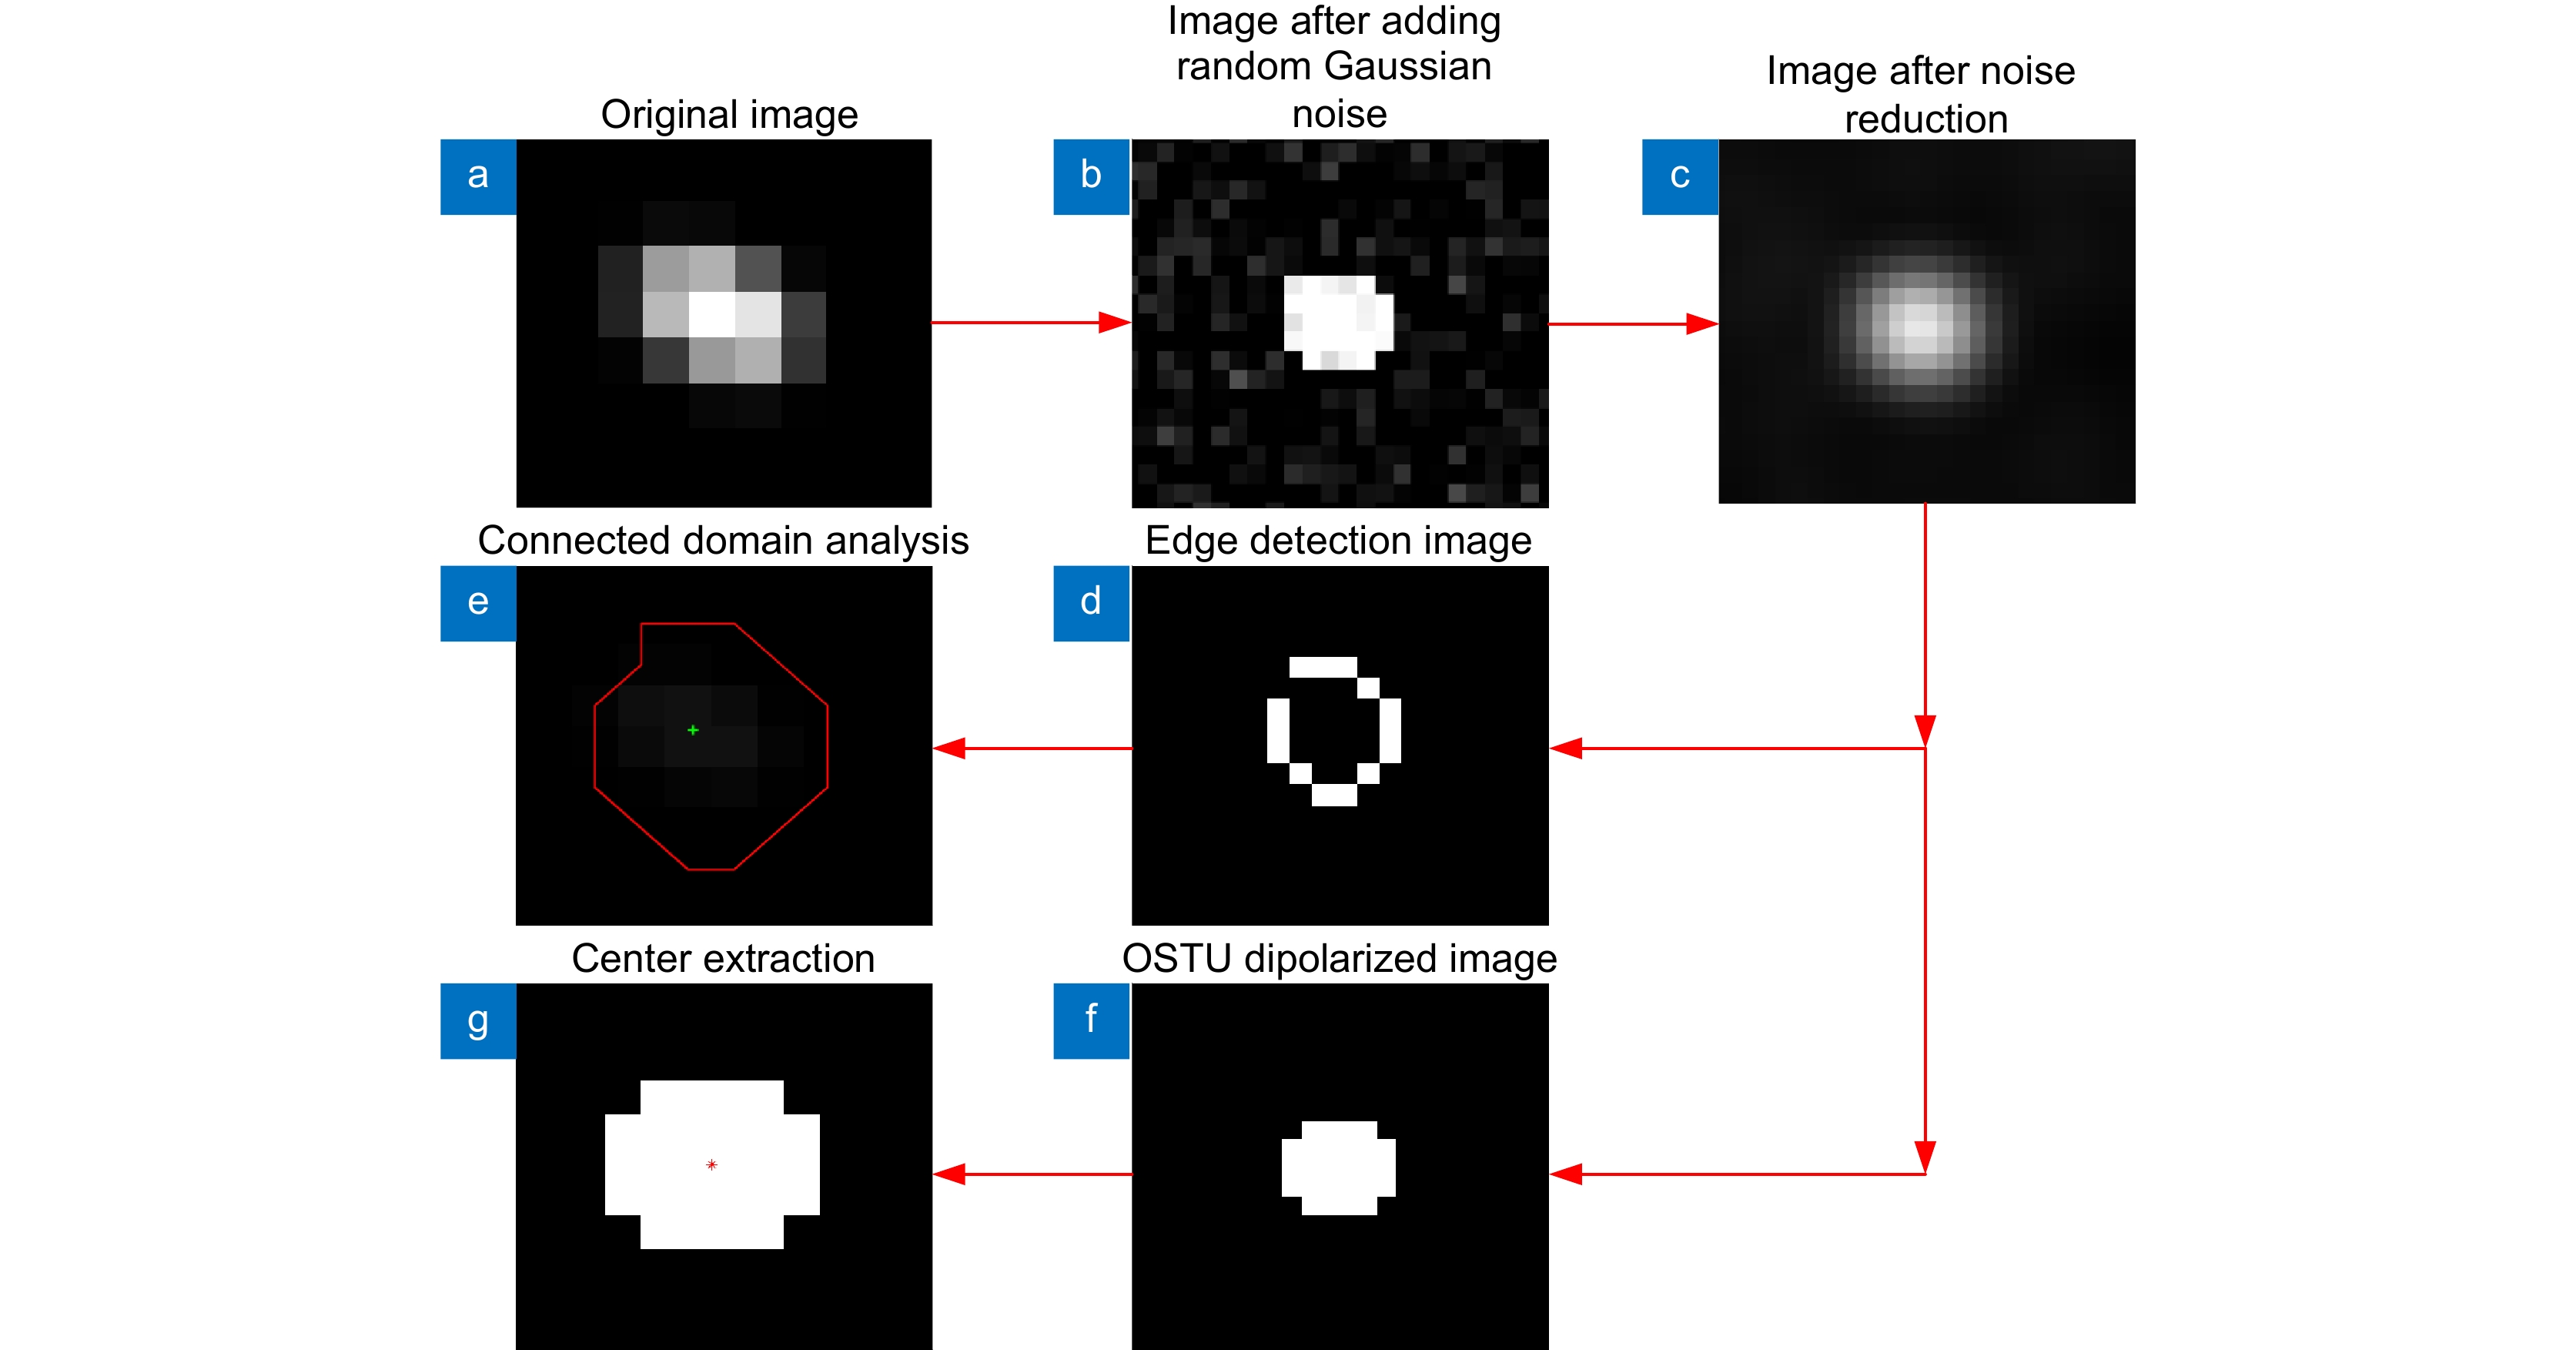
Figure 6.
Schematic diagram of center of mass extraction. (a) Original image; (b) Addition of Gaussian noise; (c) Background noise reduction; (d) Edge extraction; (e) Connected domain analysis center of mass extraction; (f) OSTU dipolarization; (g) Gray scale weighted center of mass extraction
-
Figure 7.
Two-dimensional spectrogram of mercury-argon light source imaging
-
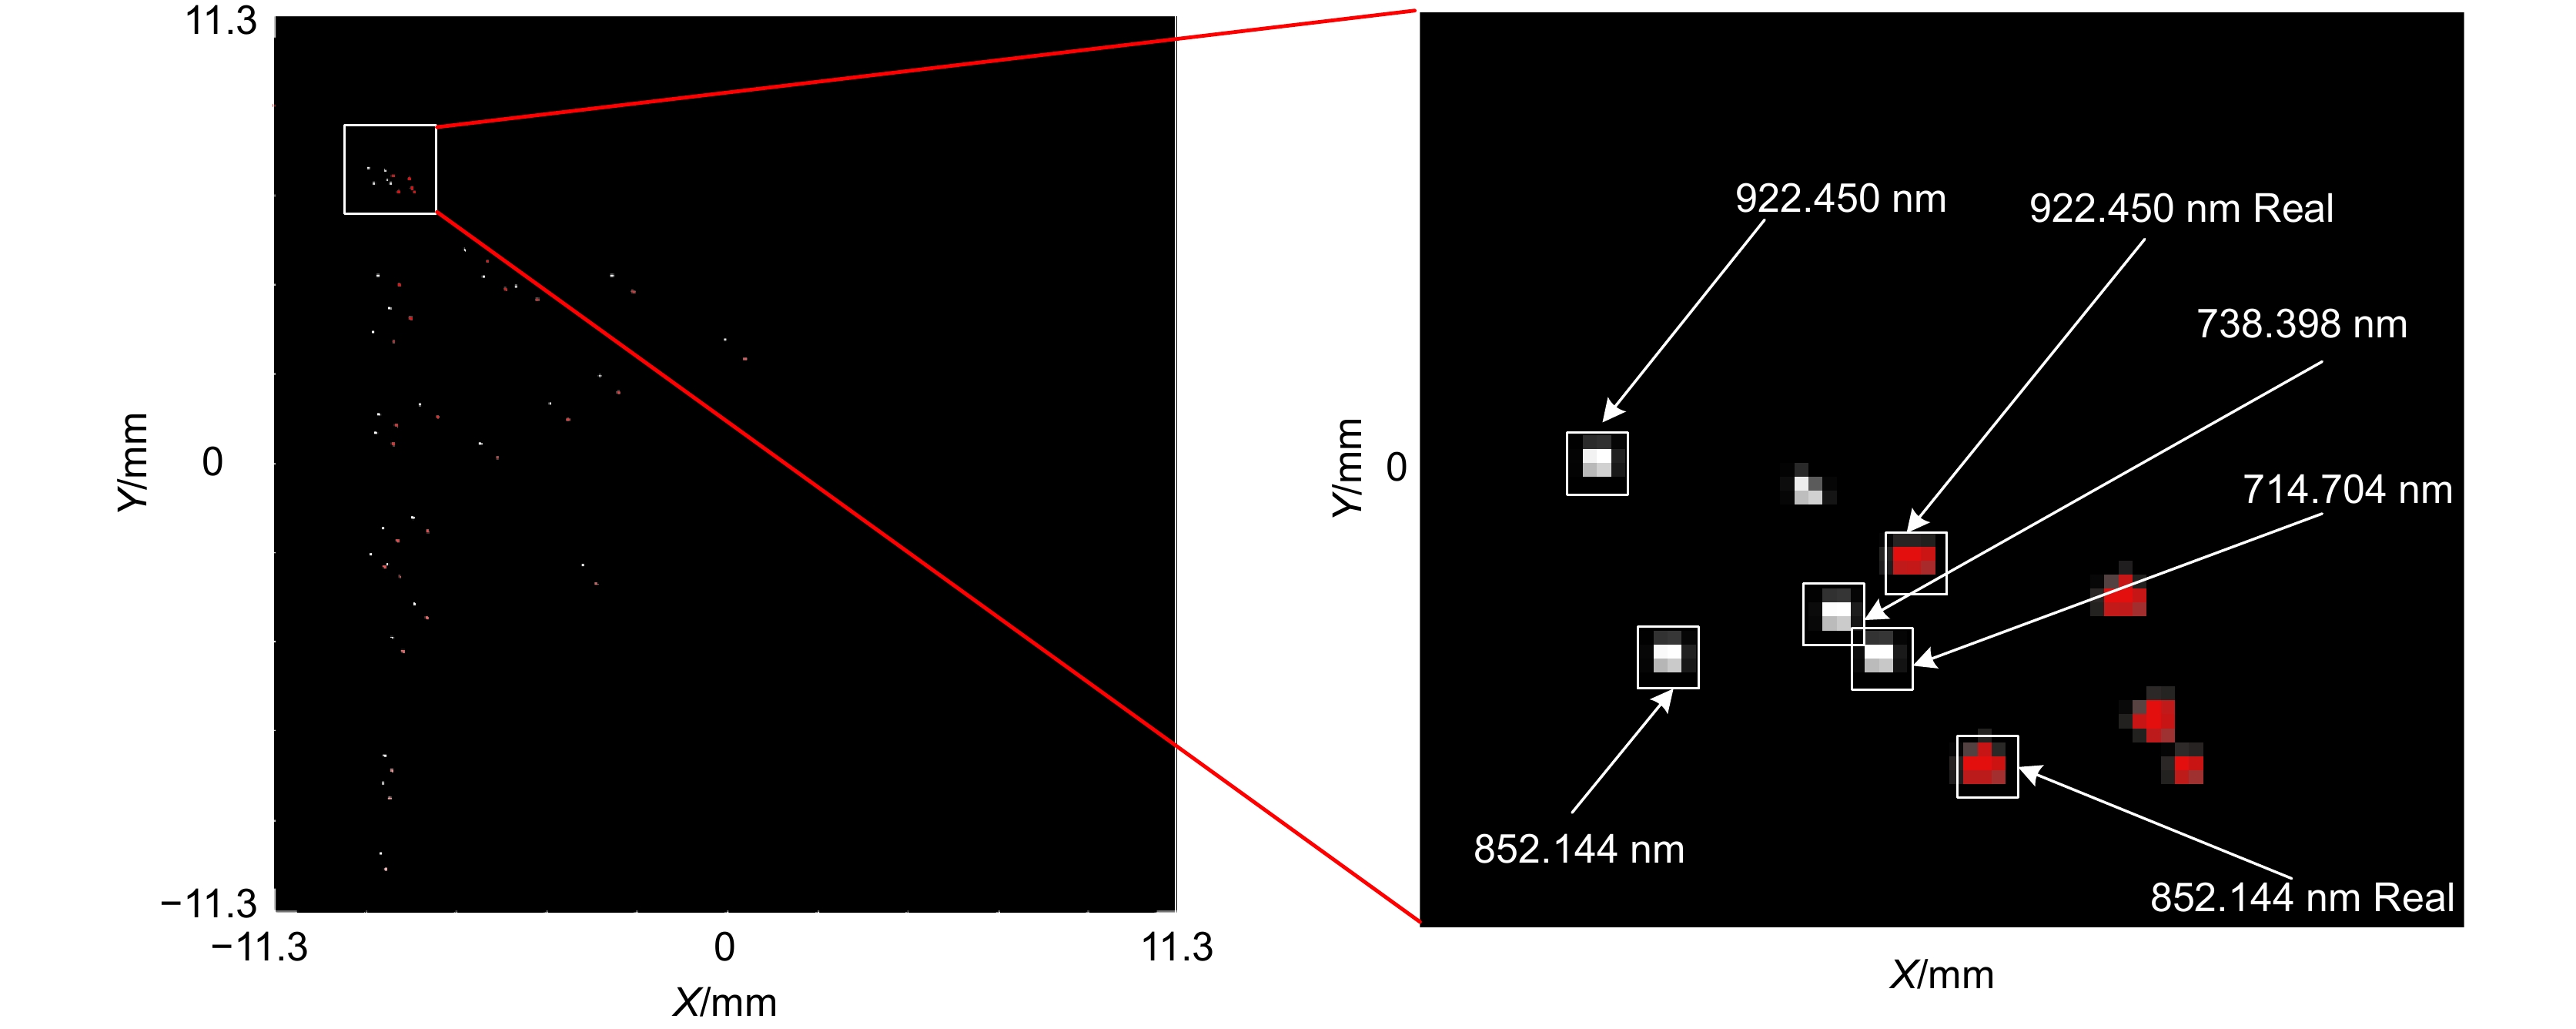
Figure 8.
Comparison of imaging spectrograms of mercury-argon light sources
-
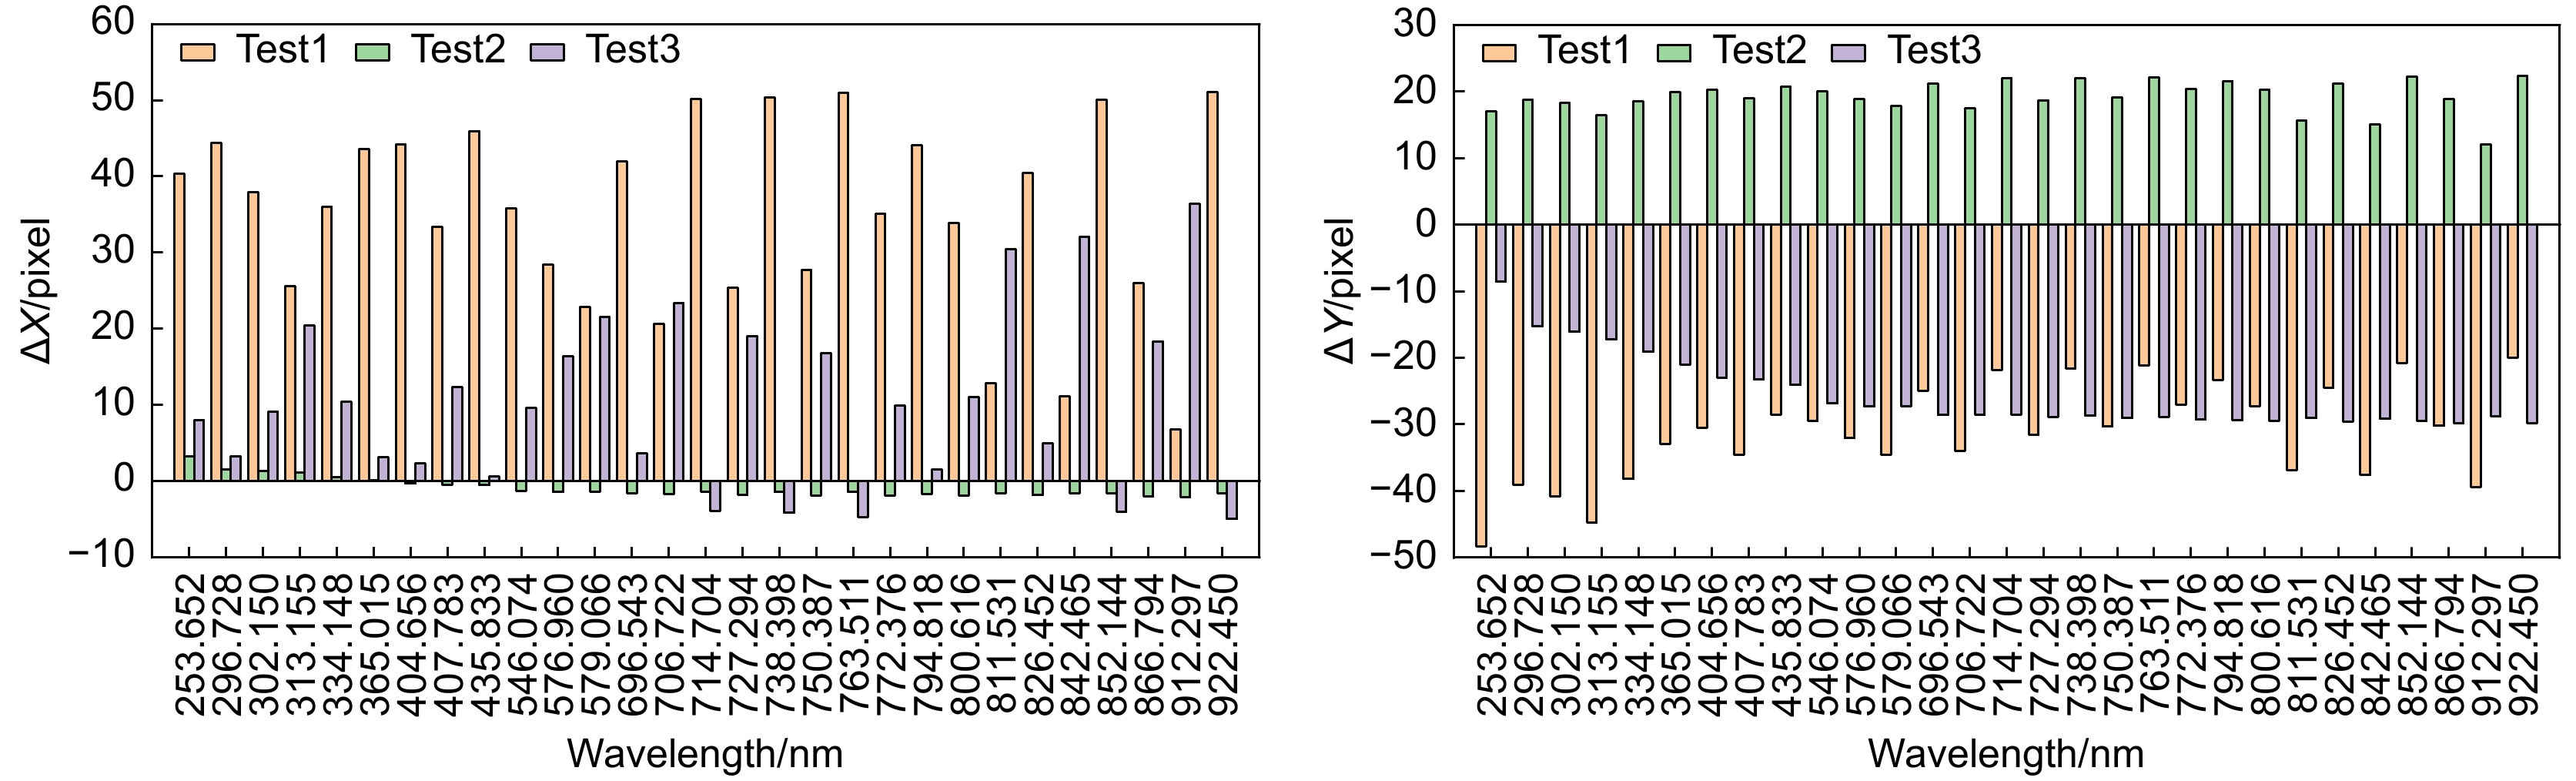
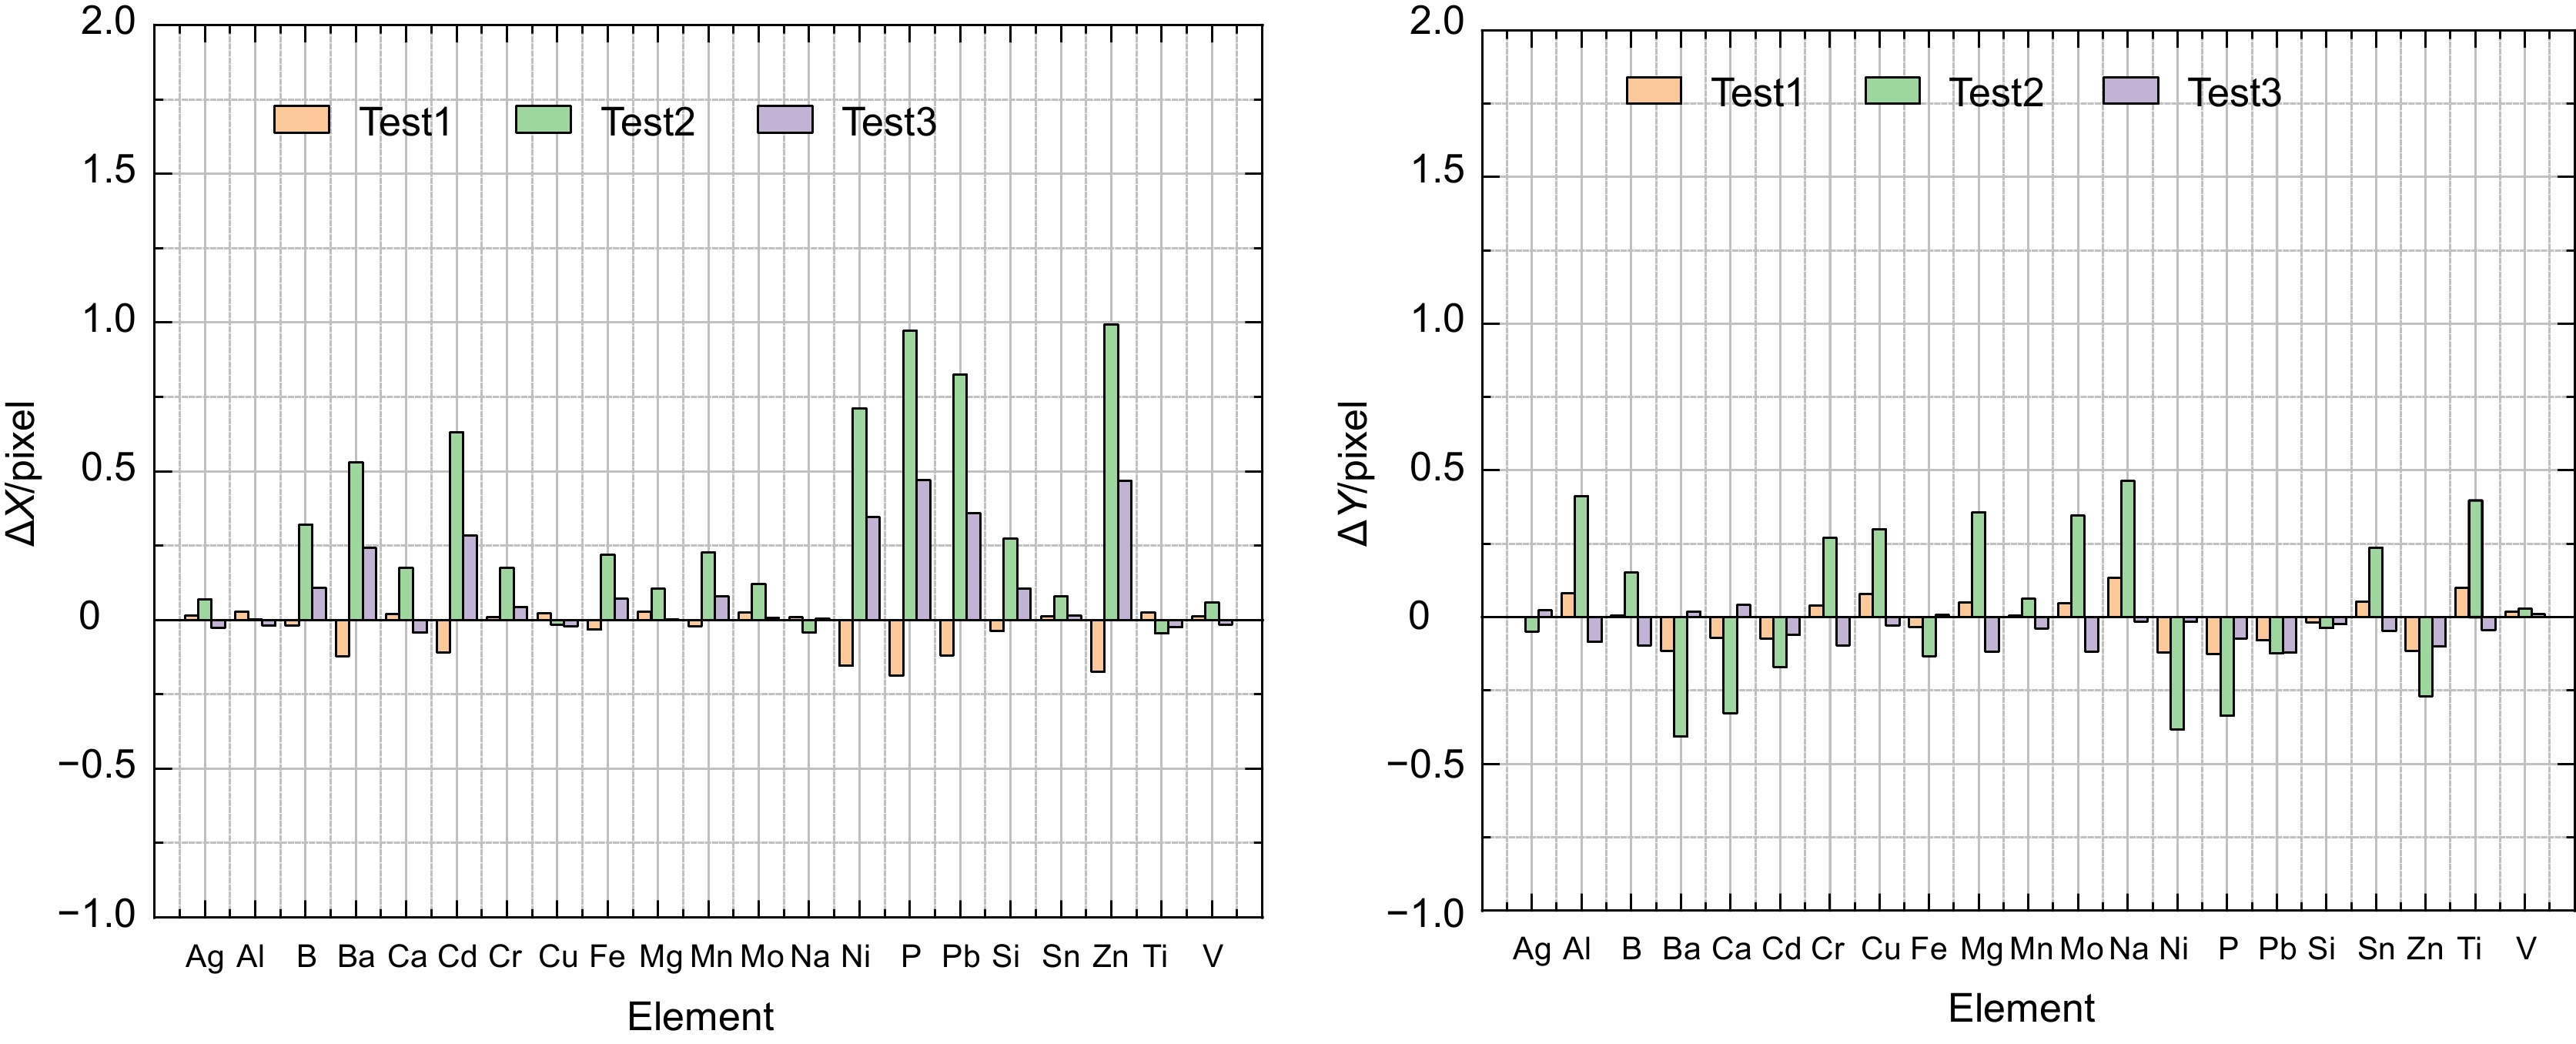
Figure 9.
Common element wavelength coordinate correction residuals
-
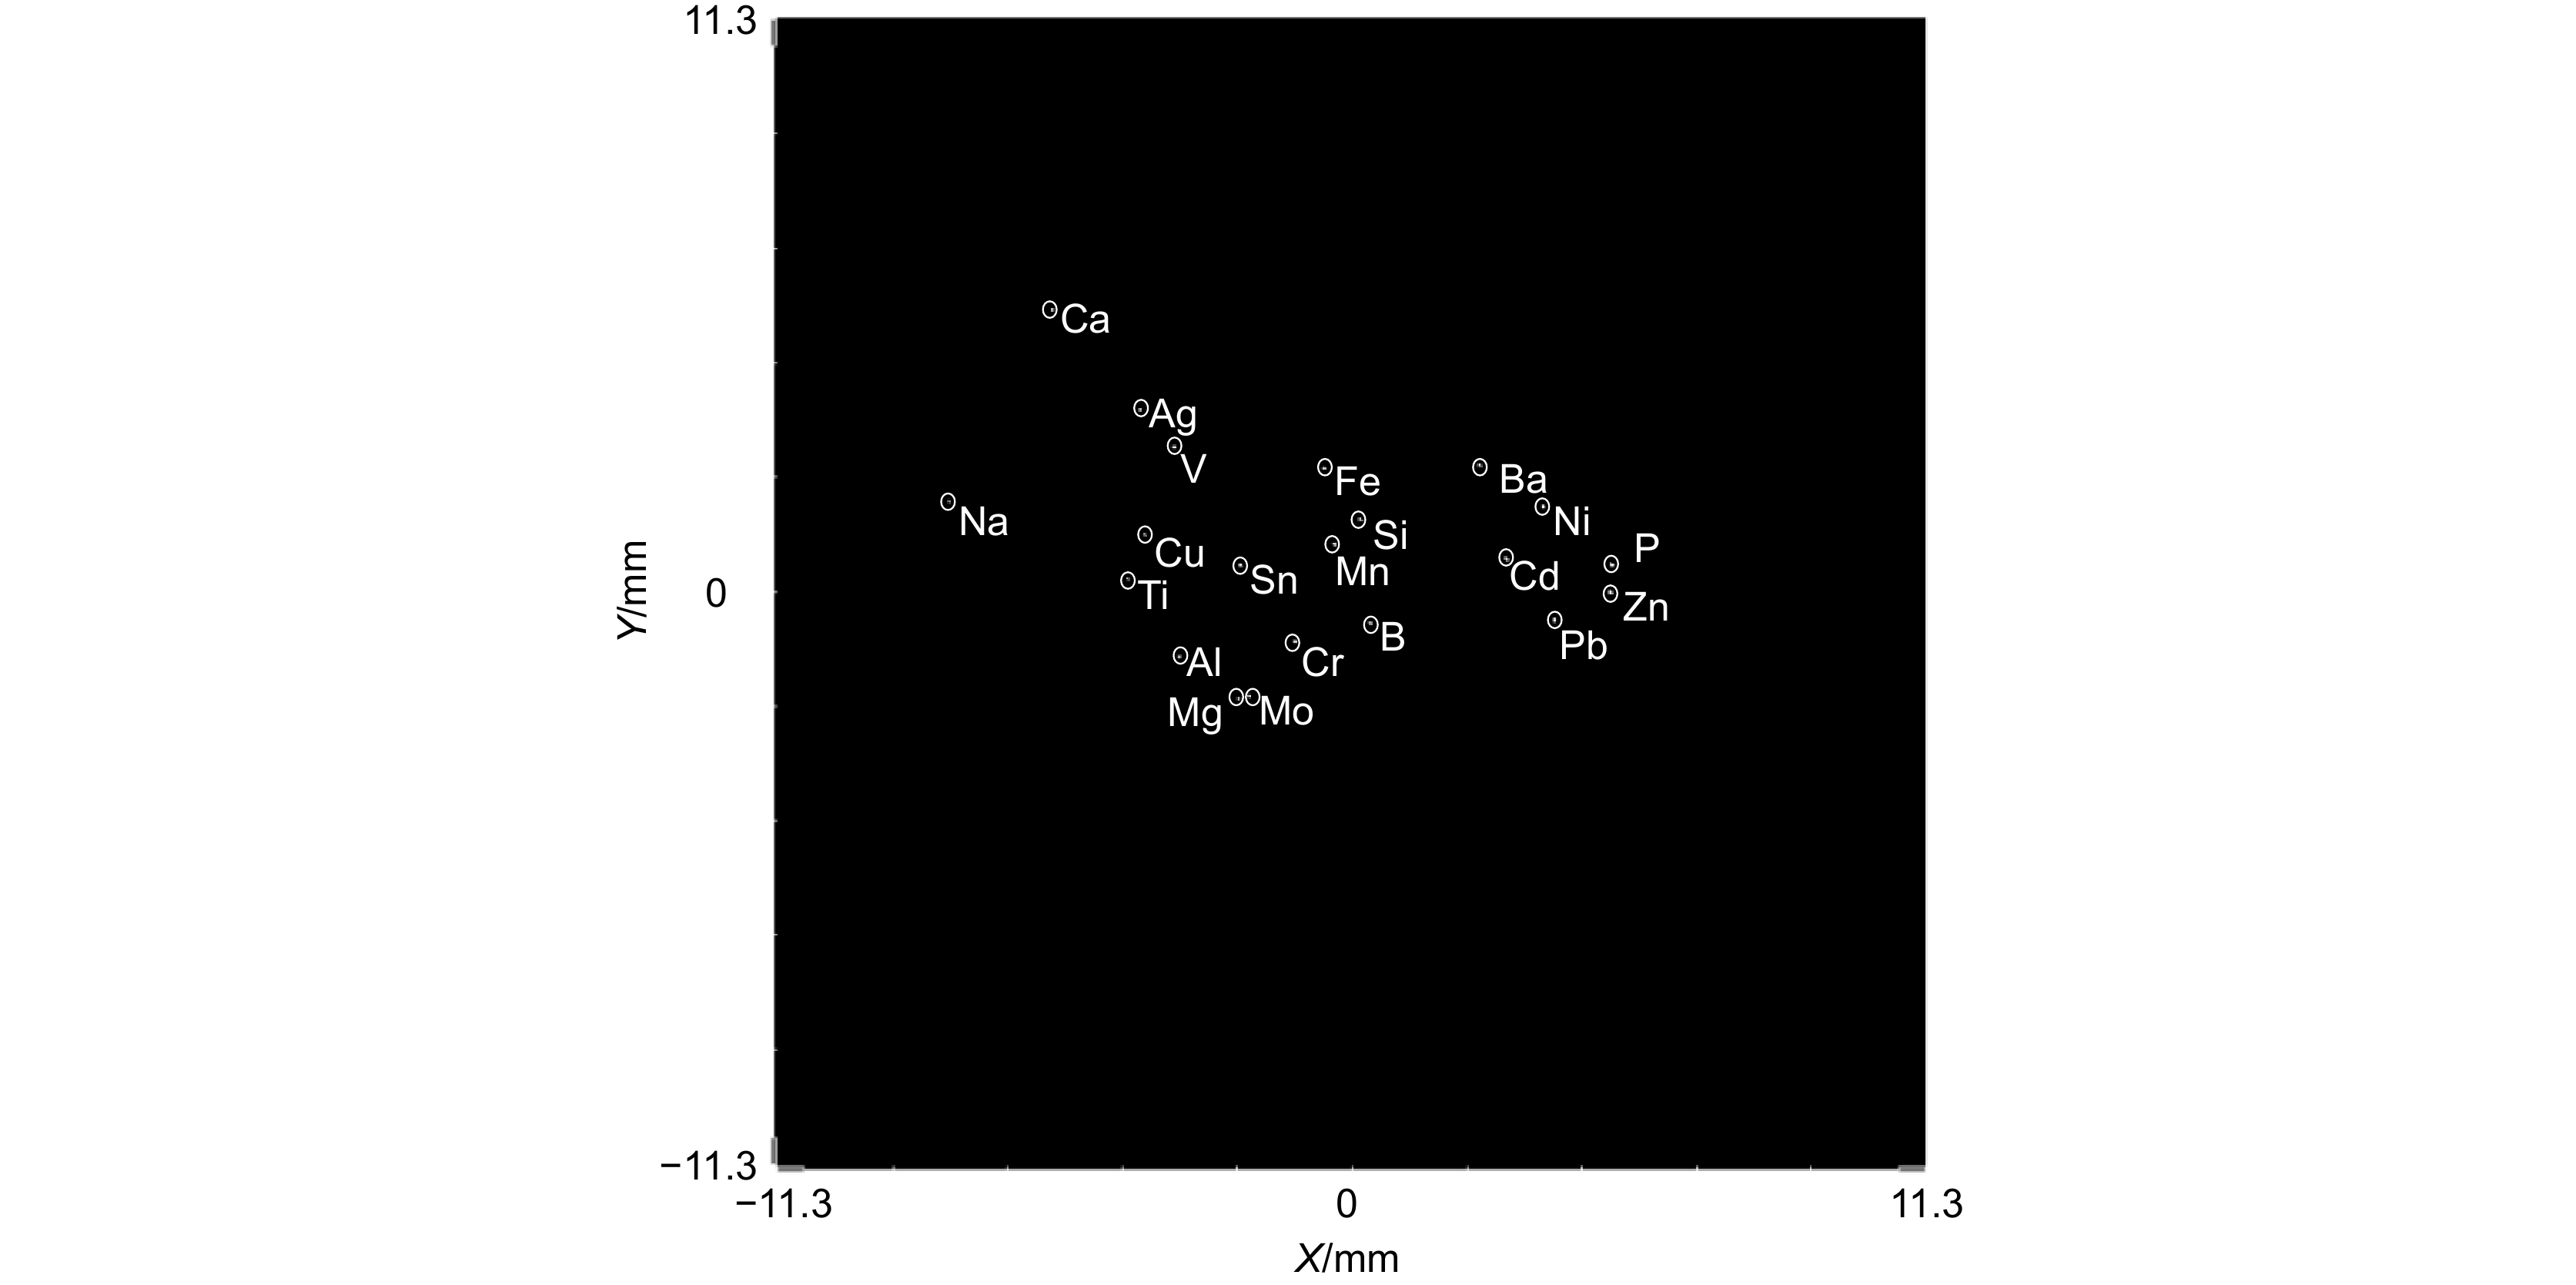
Figure 10.
Two-dimensional spectrogram of mercury-argon light source imaging
-
Figure 11.
Common element wavelength coordinate correction residuals
-
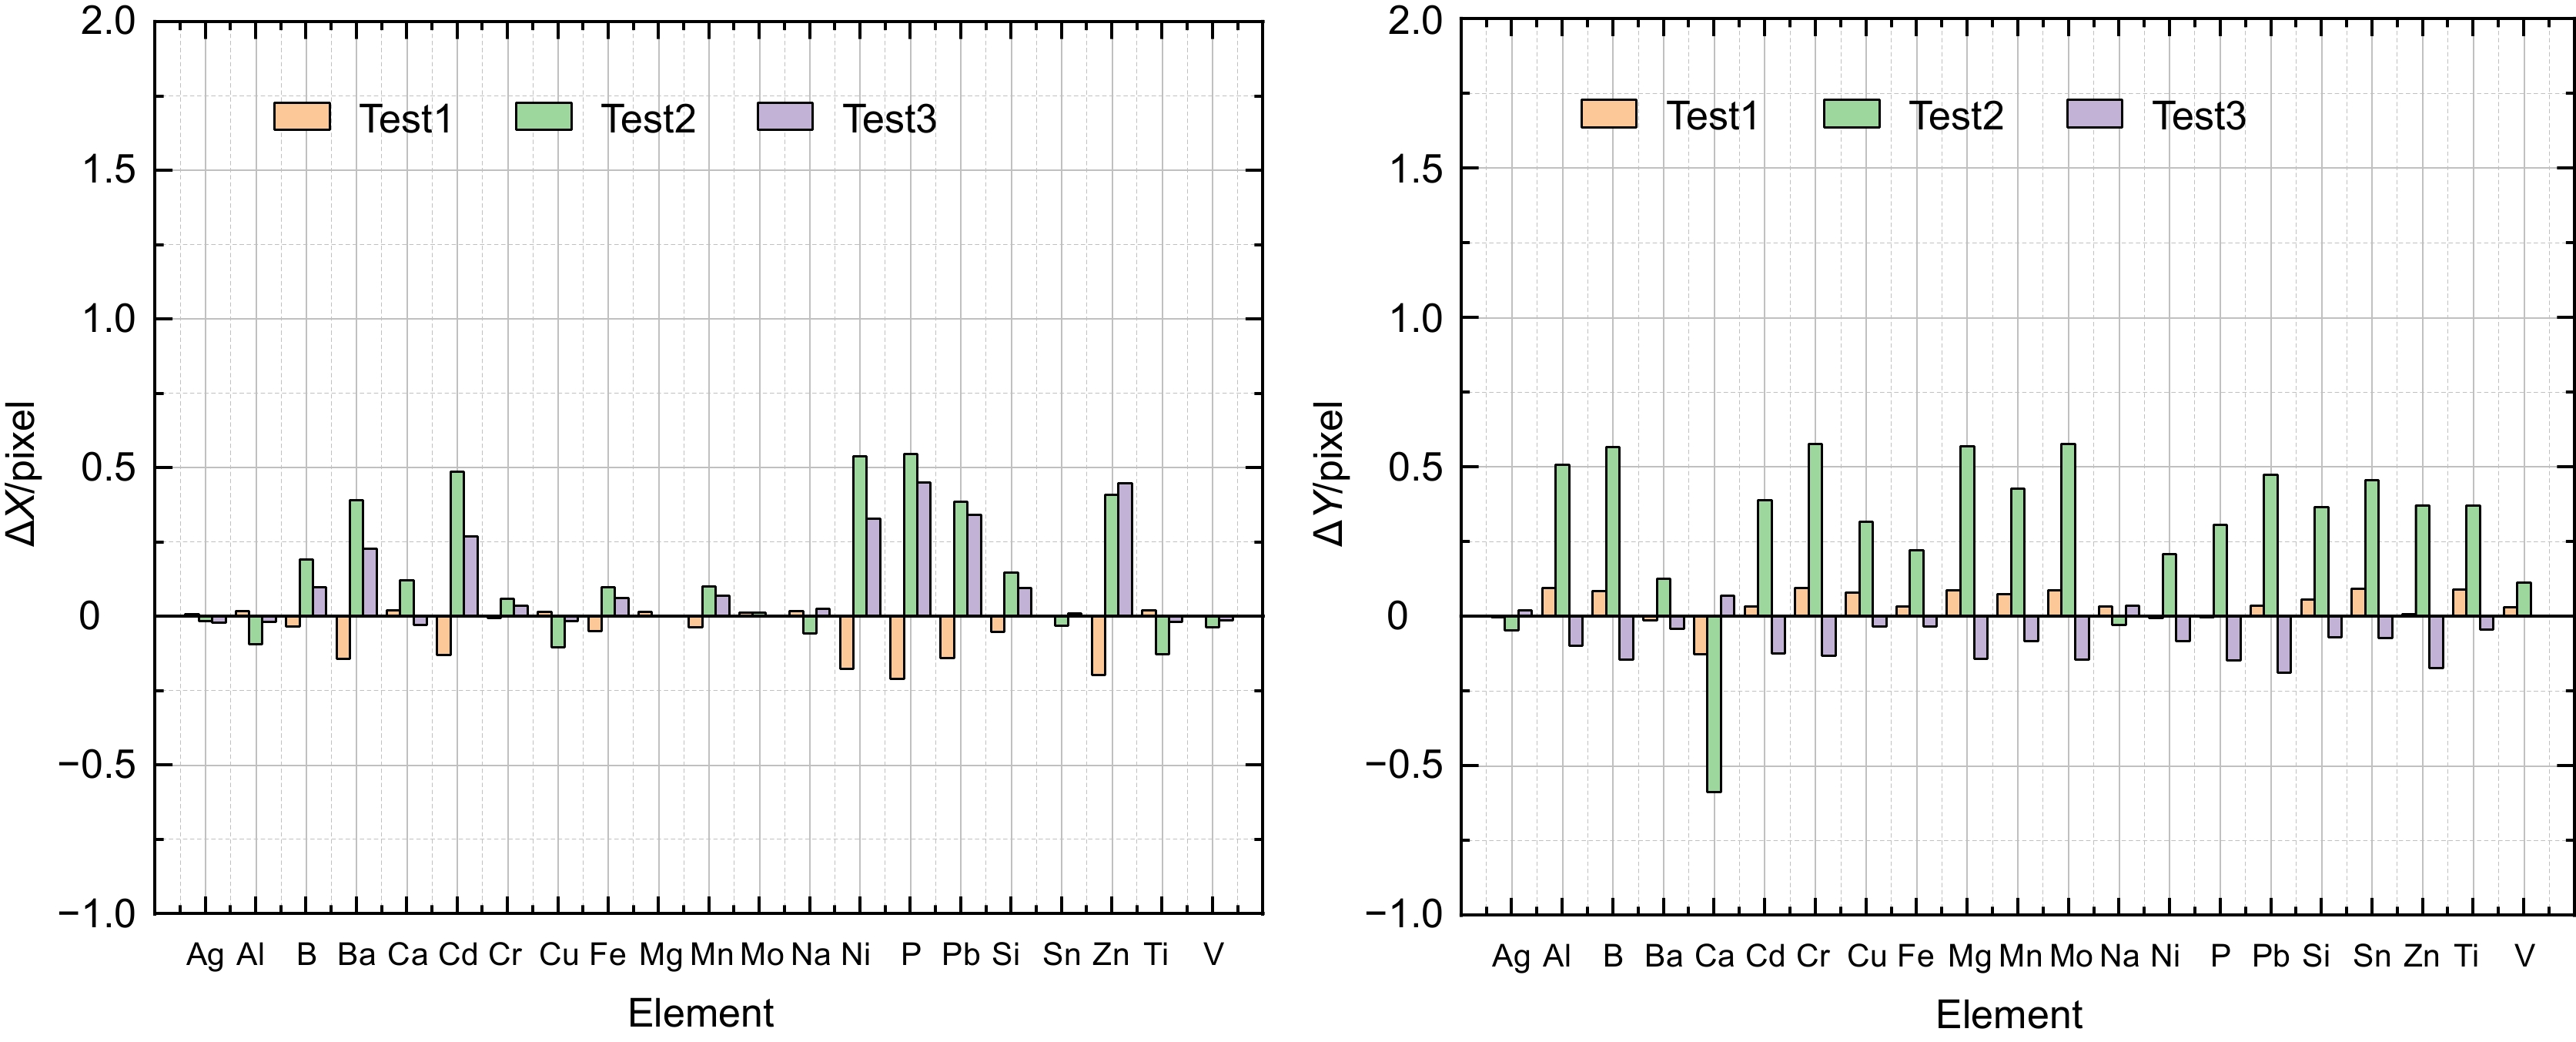
Figure 12.
Final deviation after residual compensation of wavelength coordinates of common elements
- Figure .


