
 E-mail Alert
 RSS
RSS
| Citation: |
Luo H, Hou M D, Xu L, et al. Optical fiber integrated unlabeled differential super-resolution microscopic imaging system[J]. Opto-Electron Eng, 2023, 50(12): 230181. doi: 10.12086/oee.2023.230181

|
Optical fiber integrated unlabeled differential super-resolution microscopic imaging system
-
Abstract
Far-field super-resolution microscopic imaging technology based on fluorescent labels opened a gate to the microscopic world, which has become an important tool in the research of modern medicine and life science. However, the development of far-field unlabeled super-resolution microscopy is relatively slow. Here, an integrated differential microscopic imaging method using optical fiber devices is proposed in this article. The generation of hollow spots in the differential imaging system is realized by a special fiber mode selection coupler (MSC). The problem of strict alignment between hollow and solid spots is naturally solved in this method. A highly integrated label-free microscopic imaging system was established. In experiments, gold particles with a diameter of 150 nm and unlabeled polymer lines with a minimum spacing of about 50 nm were imaged to test the imaging system. The resolution of the imaging system shows great improvement compared to conventional scanning confocal microscopy. -

-
References
[1] Hell S W, Wichmann J. Breaking the diffraction resolution limit by stimulated emission: stimulated-emission-depletion fluorescence microscopy[J]. Opt Lett, 1994, 19(11): 780−782. doi: 10.1364/OL.19.000780 [2] Gu M, Kang H, Li X P. Breaking the diffraction-limited resolution barrier in fiber-optical two-photon fluorescence endoscopy by an azimuthally-polarized beam[J]. Sci Rep, 2014, 4: 3627. doi: 10.1038/srep03627 [3] Yan L, Kristensen P, Ramachandran S. All-fiber STED microscopy illumination system[C]//Proceedings of 2016 Conference on Lasers and Electro-Optics, San Jose, 2016. https://ieeexplore.ieee.org/document/7788790 [4] Luo M Y, Sun D Q, Yang Y J, et al. Three-dimensional isotropic STED microscopy generated by 4π focusing of a radially polarized vortex Laguerre–Gaussian beam[J]. Opt Commun, 2020, 463: 125434. doi: 10.1016/j.optcom.2020.125434 [5] Rust M J, Bates M, Zhuang X W. Sub-diffraction-limit imaging by stochastic optical reconstruction microscopy (STORM)[J]. Nat Methods, 2006, 3(10): 793−796. doi: 10.1038/nmeth929 [6] Kamiyama D, Huang B. Development in the STORM[J]. Dev Cell, 2012, 23(6): 1103−1110. doi: 10.1016/j.devcel.2012.10.003 [7] Betzig E, Patterson G H, Sougrat R, et al. Imaging intracellular fluorescent proteins at nanometer resolution[J]. Science, 2006, 313(5793): 1642−1645. doi: 10.1126/science.1127344 [8] Shroff H, White H, Betzig E. Photoactivated localization microscopy (PALM) of adhesion complexes[DB/OL]. Curr Protoc Cell Biol, 2008. https://doi.org/10.1002/0471143030.cb0421s58 [9] Gustafsson M G. Surpassing the lateral resolution limit by a factor of two using structured illumination microscopy[J]. J Microsc, 2000, 198(Pt 2): 82–87. https://doi.org/10.1046/j.1365-2818.2000.00710.x. [10] Heintzmann R, Cremer C G. Laterally modulated excitation microscopy: improvement of resolution by using a diffraction grating[J]. Proc SPIE, 1999, 3568: 185−196. doi: 10.1117/12.336833 [11] Kuang C F, Li S, Liu W, et al. Breaking the diffraction barrier using fluorescence emission difference microscopy[J]. Sci Rep, 2013, 3: 1441. doi: 10.1038/srep01441 [12] 张子建, 徐欣, 王吉祥, 等. 光片荧光显微镜研究进展[J]. 光电工程, 2023, 50(5): 220045. Zhang Z J, Xu X, Wang J X, et al. Review of the development of light sheet fluorescence microscopy[J]. Opto-Electron Eng, 2023, 50(5): 220045. [13] Xiao Y T, Chen L W, Pu M B, et al. Improved spatiotemporal resolution of anti-scattering super-resolution label-free microscopy via synthetic wave 3D metalens imaging[J]. Opto-Electron Sci, 2003, 2(11): 230037. [14] Chen L W, Zhou Y, Wu M X, et al. Remote-mode microsphere nano-imaging: new boundaries for optical microscopes[J]. Opto-Electron Adv, 2018, 1(1): 170001. [15] 陈雪松,杜文娟,楼志浪,等. 基于光频双曲超材料的无标记远场超分辨显微成像[J]. 光电工程, 2022, 49(11): 220056. Chen X S, Du W J, Lou Z L, et al. Label-free far-field subdiffraction imaging based on hyperbolic metamaterial[J]. Opto-Electron Eng, 2022, 49(11): 220056. [16] Kireev A N, Graf T. Vector coupled-mode theory of dielectric waveguides[J]. IEEE J Quantum Electron, 2003, 39(7): 866−873. doi: 10.1109/JQE.2003.813187 [17] Volpe G, Petrov D. Generation of cylindrical vector beams with few-mode fibers excited by Laguerre–Gaussian beams[J]. Opt Commun, 2004, 237(1-3): 89−95. doi: 10.1016/j.optcom.2004.03.080 [18] Quabis S, Dorn R, Leuchs G. Generation of a radially polarized doughnut mode of high quality[J]. Appl Phys B, 2005, 81(5): 597−600. doi: 10.1007/s00340-005-1887-1 [19] Kireev A N, Graf T. Symmetric vector coupled-mode theory of dielectric waveguides[J]. Opt Commun, 2005, 244(1-6): 25−35. doi: 10.1016/j.optcom.2004.07.067 [20] Xiao J B, Sun X H. Full-vectorial mode solver for anisotropic optical waveguides using multidomain spectral collocation method[J]. Opt Commun, 2010, 283(14): 2835−2840. doi: 10.1016/j.optcom.2010.03.057 [21] Luo H, Wang G R, Yuan L B. A special three-layer step-index fiber for building compact STED systems[J]. Sci Rep, 2019, 9(1): 8455. doi: 10.1038/s41598-019-44905-w [22] Zou J H, Wang H J, Li W W, et al. Visible-wavelength all-fiber vortex laser[J]. IEEE Photonics Technol Lett, 2019, 31(18): 1487−1490. doi: 10.1109/LPT.2019.2934150 [23] Zhang W D, Huang L G, Wei K Y, et al. High-order optical vortex generation in a few-mode fiber via cascaded acoustically driven vector mode conversion[J]. Opt Lett, 2016, 41(21): 5082−5085. doi: 10.1364/OL.41.005082 [24] Yan L, Kristensen P, Ramachandran S. Vortex fibers for STED microscopy[J]. APL Photonics, 2019, 4(2): 022903. doi: 10.1063/1.5045233 -
Overview
Fluorescence emission difference (FED) microscopy was first applied to fluorescent samples. However, given its basic principle, this microscopy also can perform super-resolution imaging of non-fluorescent samples. In this method, solid and hollow light spots of the same wavelength are used to image the samples respectively. An image with super-resolution details can be achieved through data processing of the two images. In traditional methods, the generation and modulation of hollow and solid light spots are based on a spatial light modulator or vortex phase plate and multiple groups of spatial optical devices, resulting in a complex system that is susceptible to external interference.
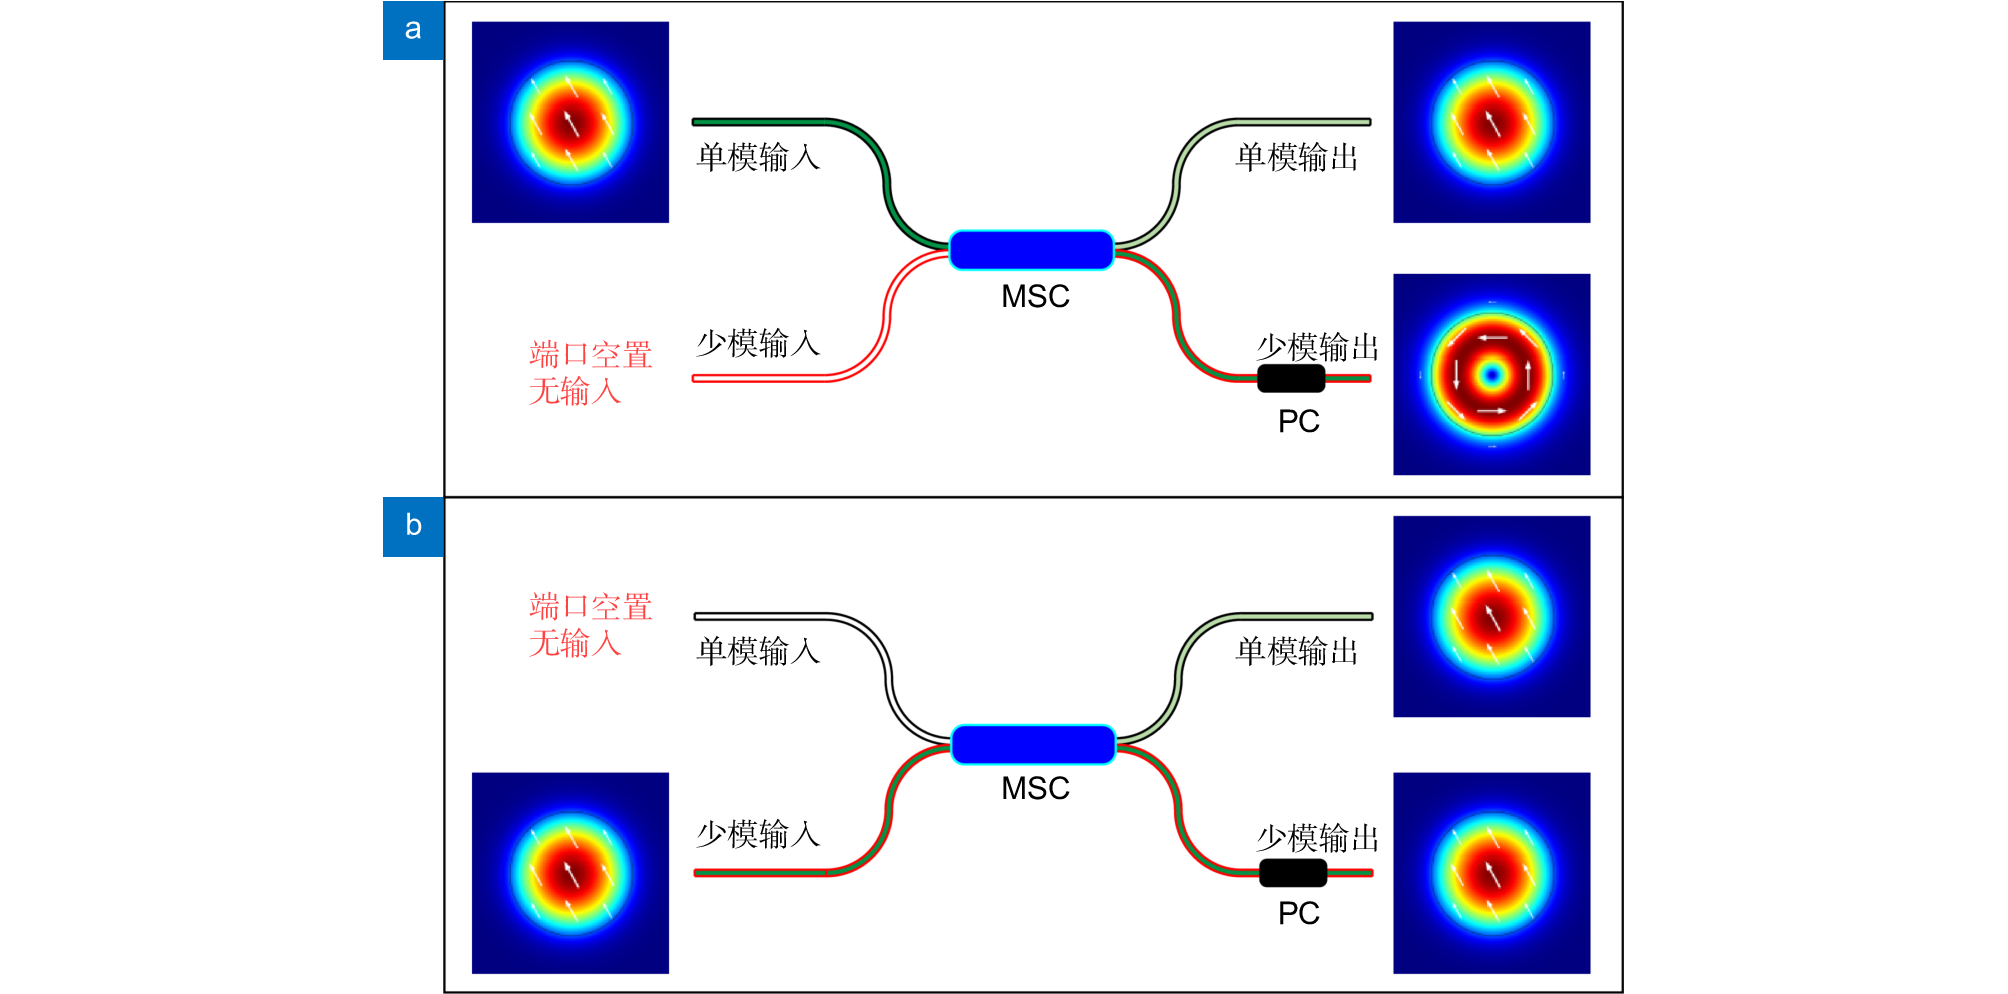
In this article, we proposed a modified FED microscopy based on a special Optical Fiber Mode Selection Coupler (MSC). The coupler has two input ports: Gaussian light beam input through one of the input ports will be converted into a vortex beam which has circular optical field distribution; Gaussian light beam input through the other input port will be converted into the fundamental mode of the fiber which remains Gaussian optical field distribution. Since the two output beams are emitted through the same fiber, the two beams naturally propagate along the same optical axis in the subsequent optical path, which solved the problem of strict alignment between hollow spot and solid spot in a traditional FED microscopy system.
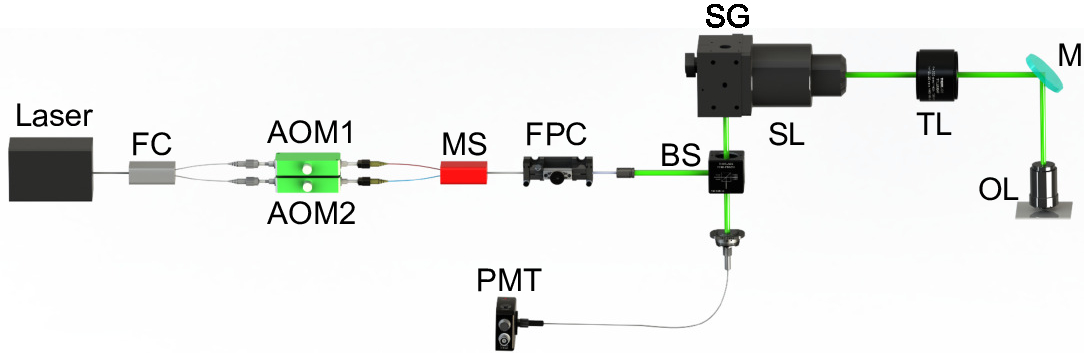
In the MSC-FED system, a continuous laser beam at a wavelength of 532 nm was emitted by a semiconductor laser. The beam was firstly divided into two channels through a single-mode fiber 1×2 coupler. Two Acousto-Optic Modulators (AOM) were integrated into two fiber optical paths to achieve high-speed switching control with rising/falling edge times of less than 10 ns. After passing through AOM, light in the two channels incident into two input ports of the MSC respectively. By the switch control of AOM, light beams in two channels alternately output solid spot and hollow spot from the special MSC. The solid spot or hollow spot was used to scan the sample through the subsequent optical elements in the system.
In experiments, gold particles with a diameter of 150 nm and unlabeled polymer lines with a minimum spacing of about 50 nm were imaged to test the imaging system. The resolution of the imaging system shows great improvement compared to conventional scanning confocal microscopy.
-
Access History


Export File
Citation
Luo H, Hou M D, Xu L, et al. Optical fiber integrated unlabeled differential super-resolution microscopic imaging system[J]. Opto-Electron Eng, 2023, 50(12): 230181. doi: 10.12086/oee.2023.230181
Format
Content
 DownLoad:


-
Figure 1.
Schematic diagram of the fiber mode selection coupler. Output of the single-mode fiber and the few-mode fiber, when the fundamental mode laser is separately launched into (a) the single-mode fiber, and (b) the few-mode fiber
-
Figure 2.
Mode effective index curves for the LP01 mode in SMF and the LP11 mode in FMF as functions of core radius, at the wavelength of 532 nm
-
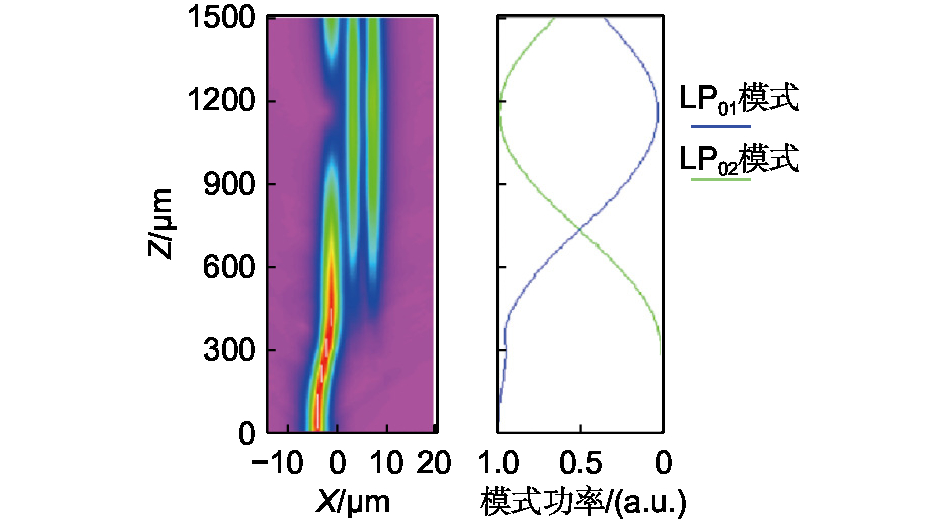
Figure 3.
Simulation of periodic transformation between the LP01 mode in the single-mode fiber and the LP11 mode in the few-mode fiber, in the coupling region of MSC
-
Figure 4.
Spectrum diagram of the output of the single-mode fiber (black curve) and the output of the low-mode fiber (red curve) when the wide-spectrum laser is injected from the single-mode fiber input of the MSC under the matching conditions. At the working wavelength of 532 nm, most of the power output is from the few-mode fiber end
-
Figure 5.
Schematic diagram of the FED imaging system based on the fiber MSC
-
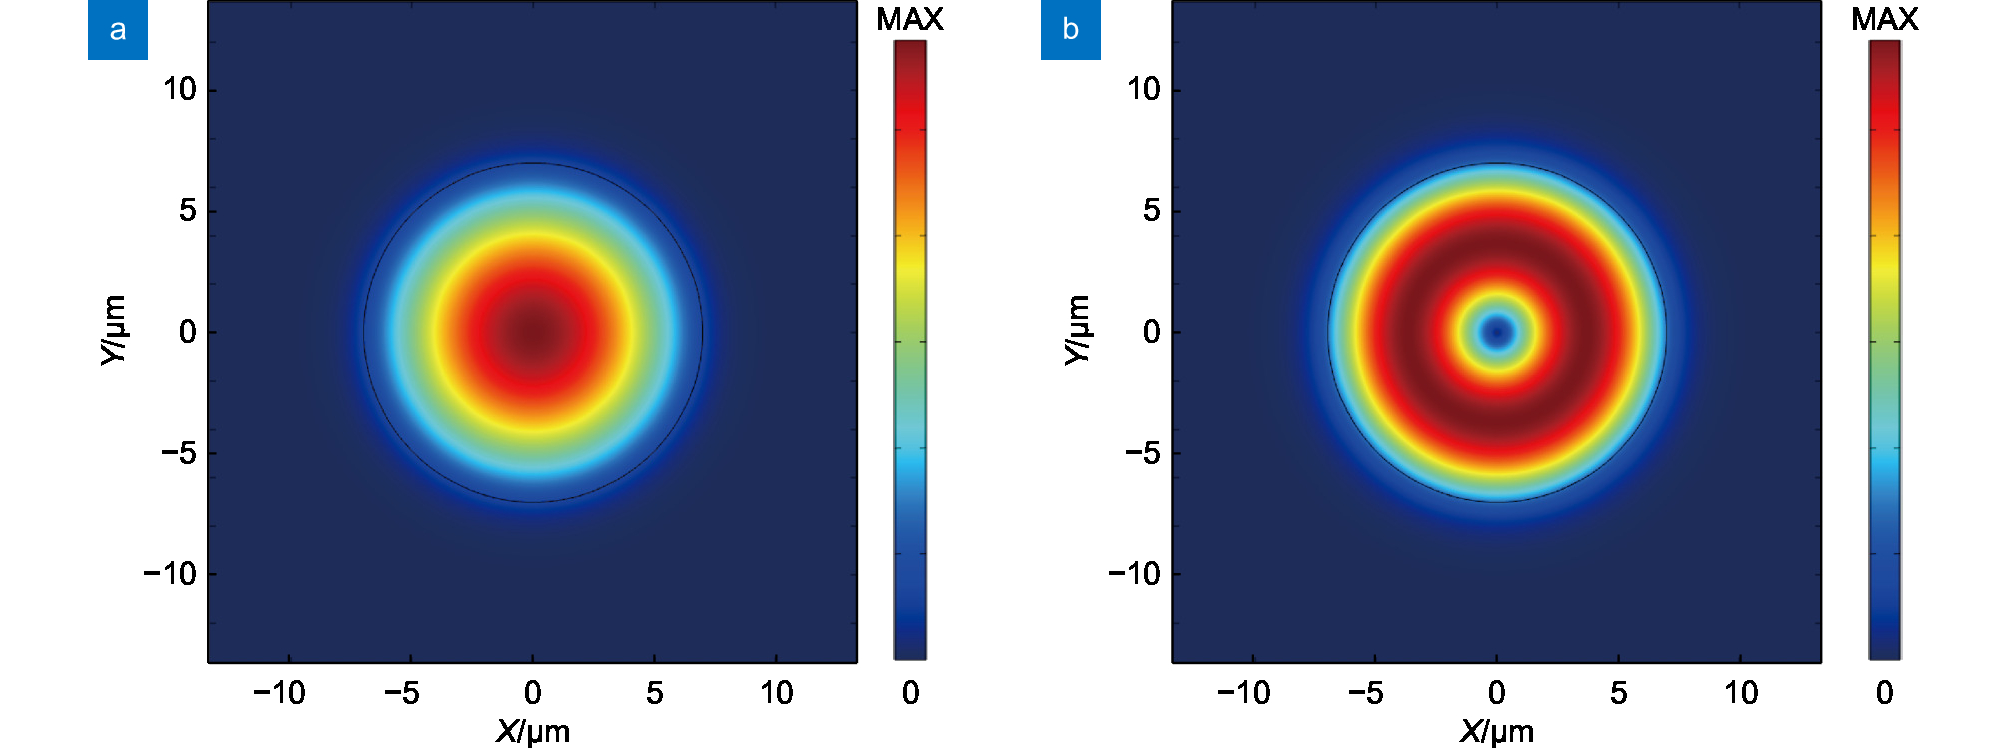
Figure 6.
Optical field distribution of the first two order eigenmodes supported by the LFM output end of MSC. (a) LP01 mode; (b) LP11 mode
-
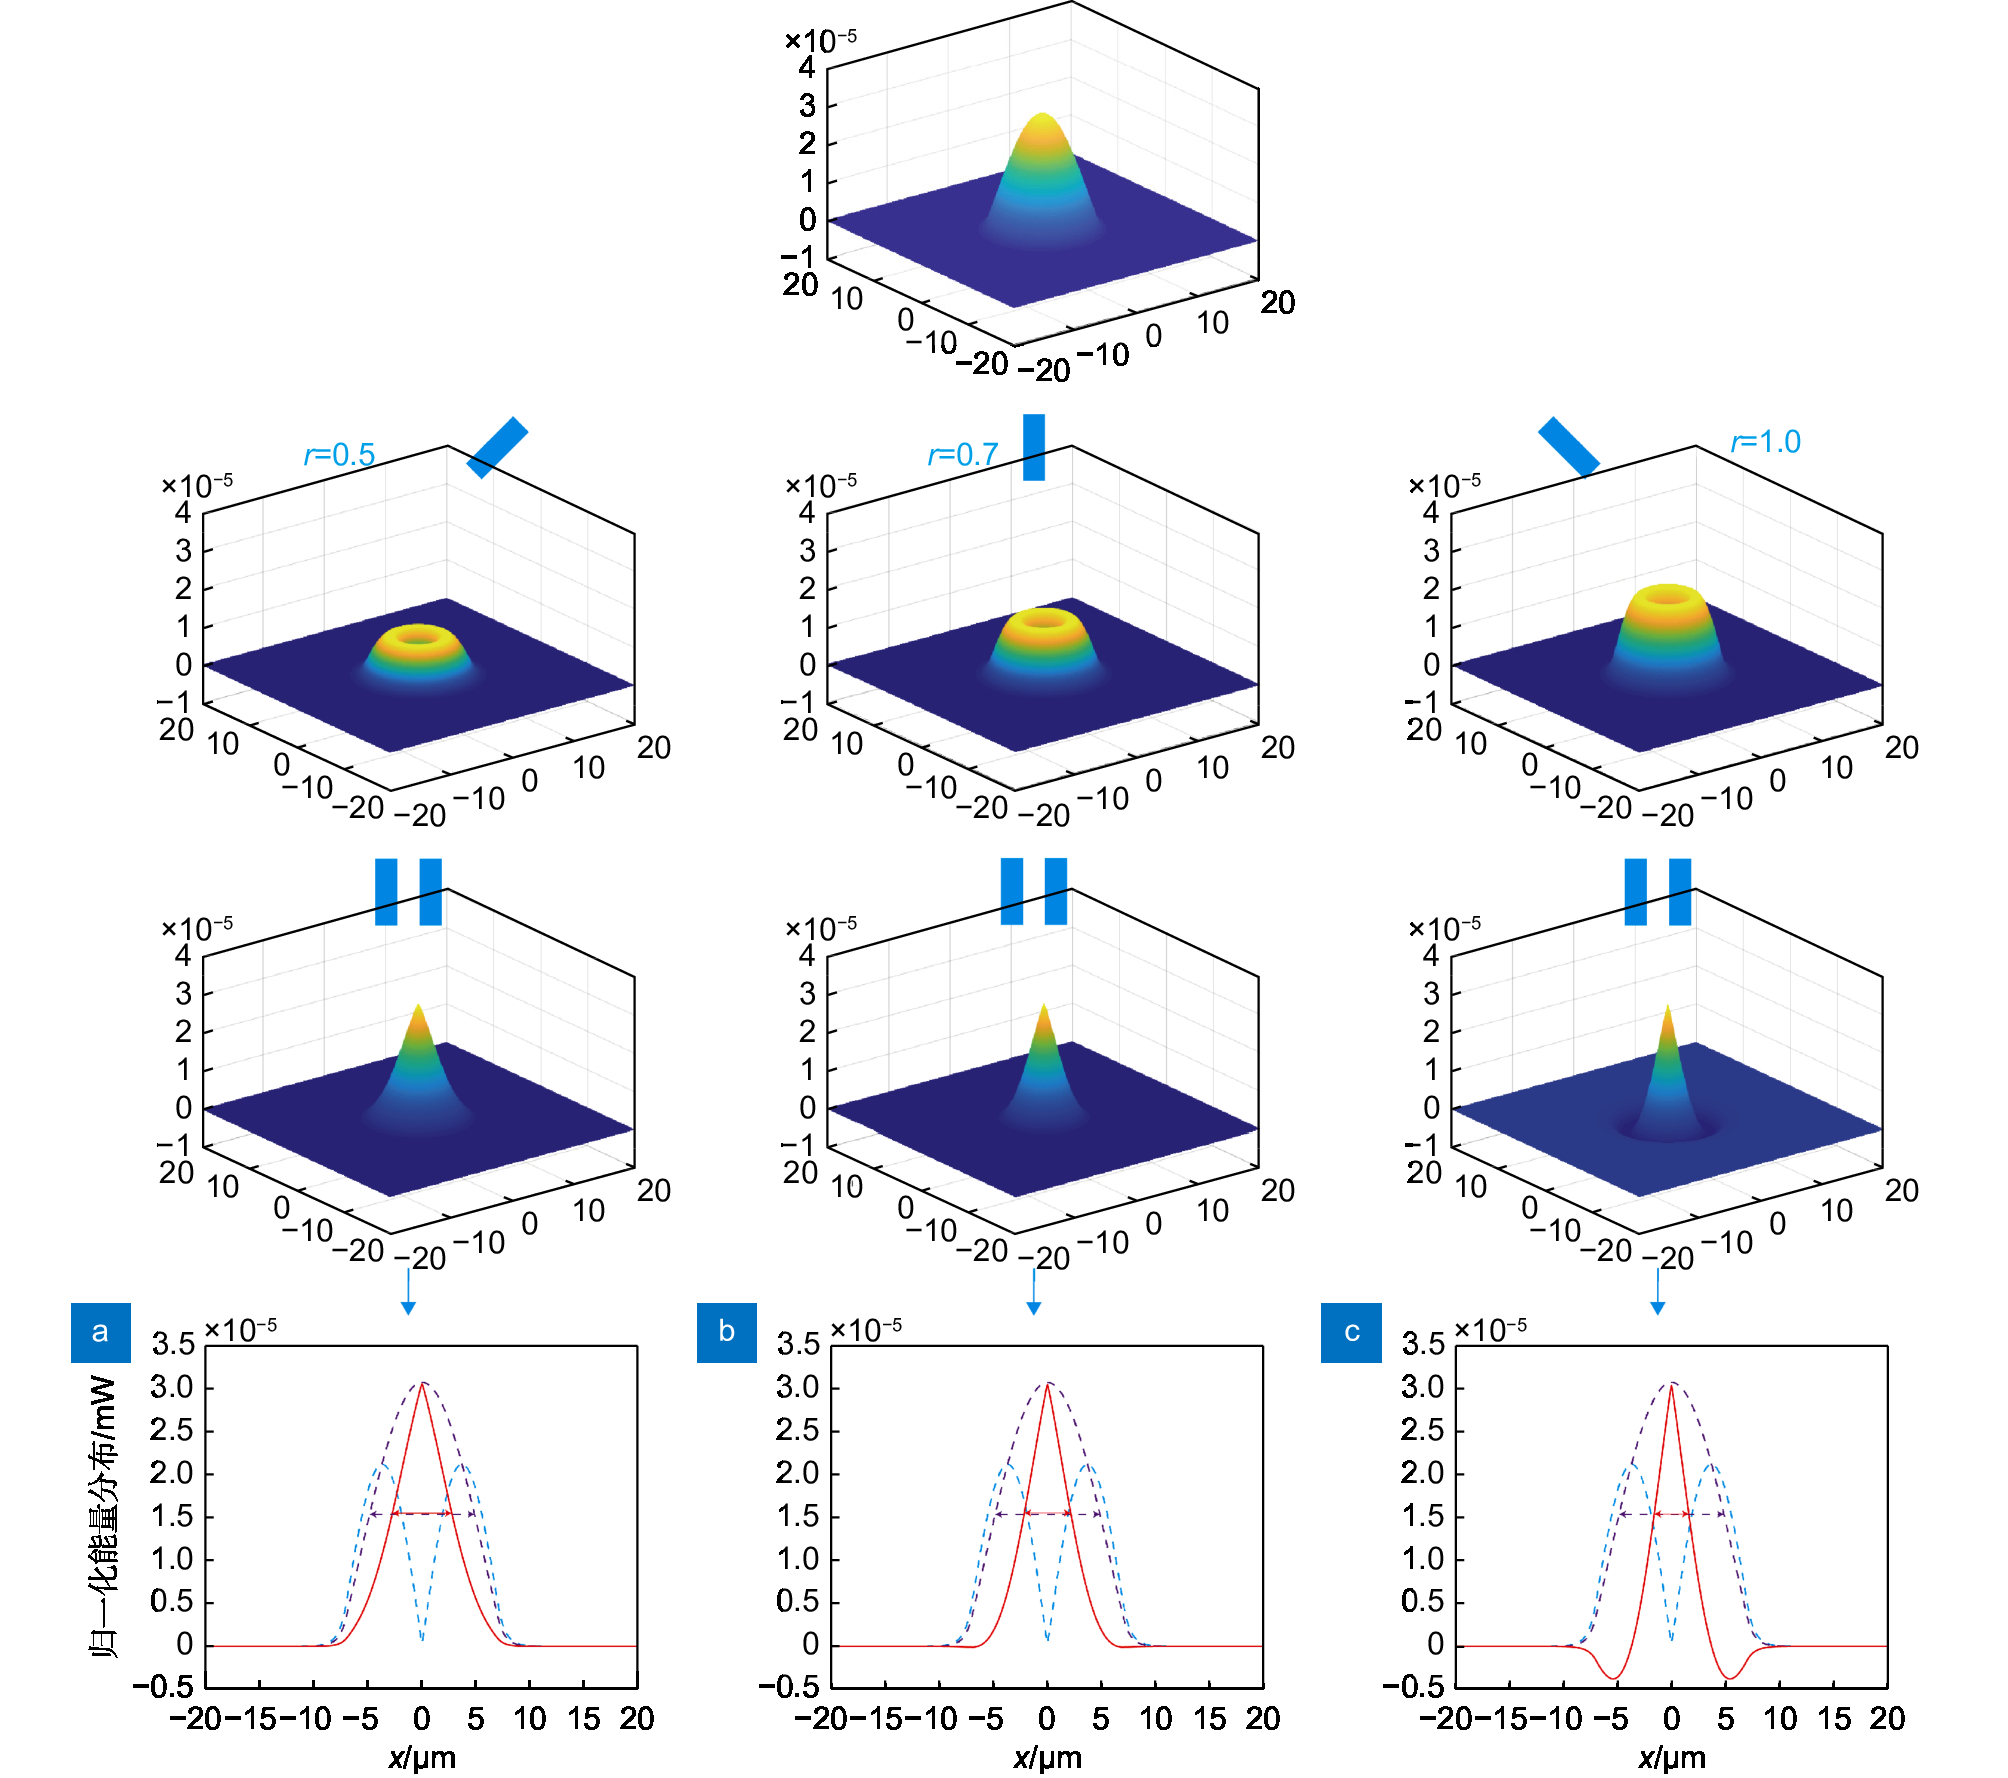
Figure 7.
Optical field distribution of solid spot (purple dashed line), hollow spot (blue dashed line), and equivalent spot (red solid line) in the FED imaging system based on the fiber MSC with different weighting coefficients, obtained at the output end of MSC. (a) r =0.5;(b) r =0.7;(c) r =1
-
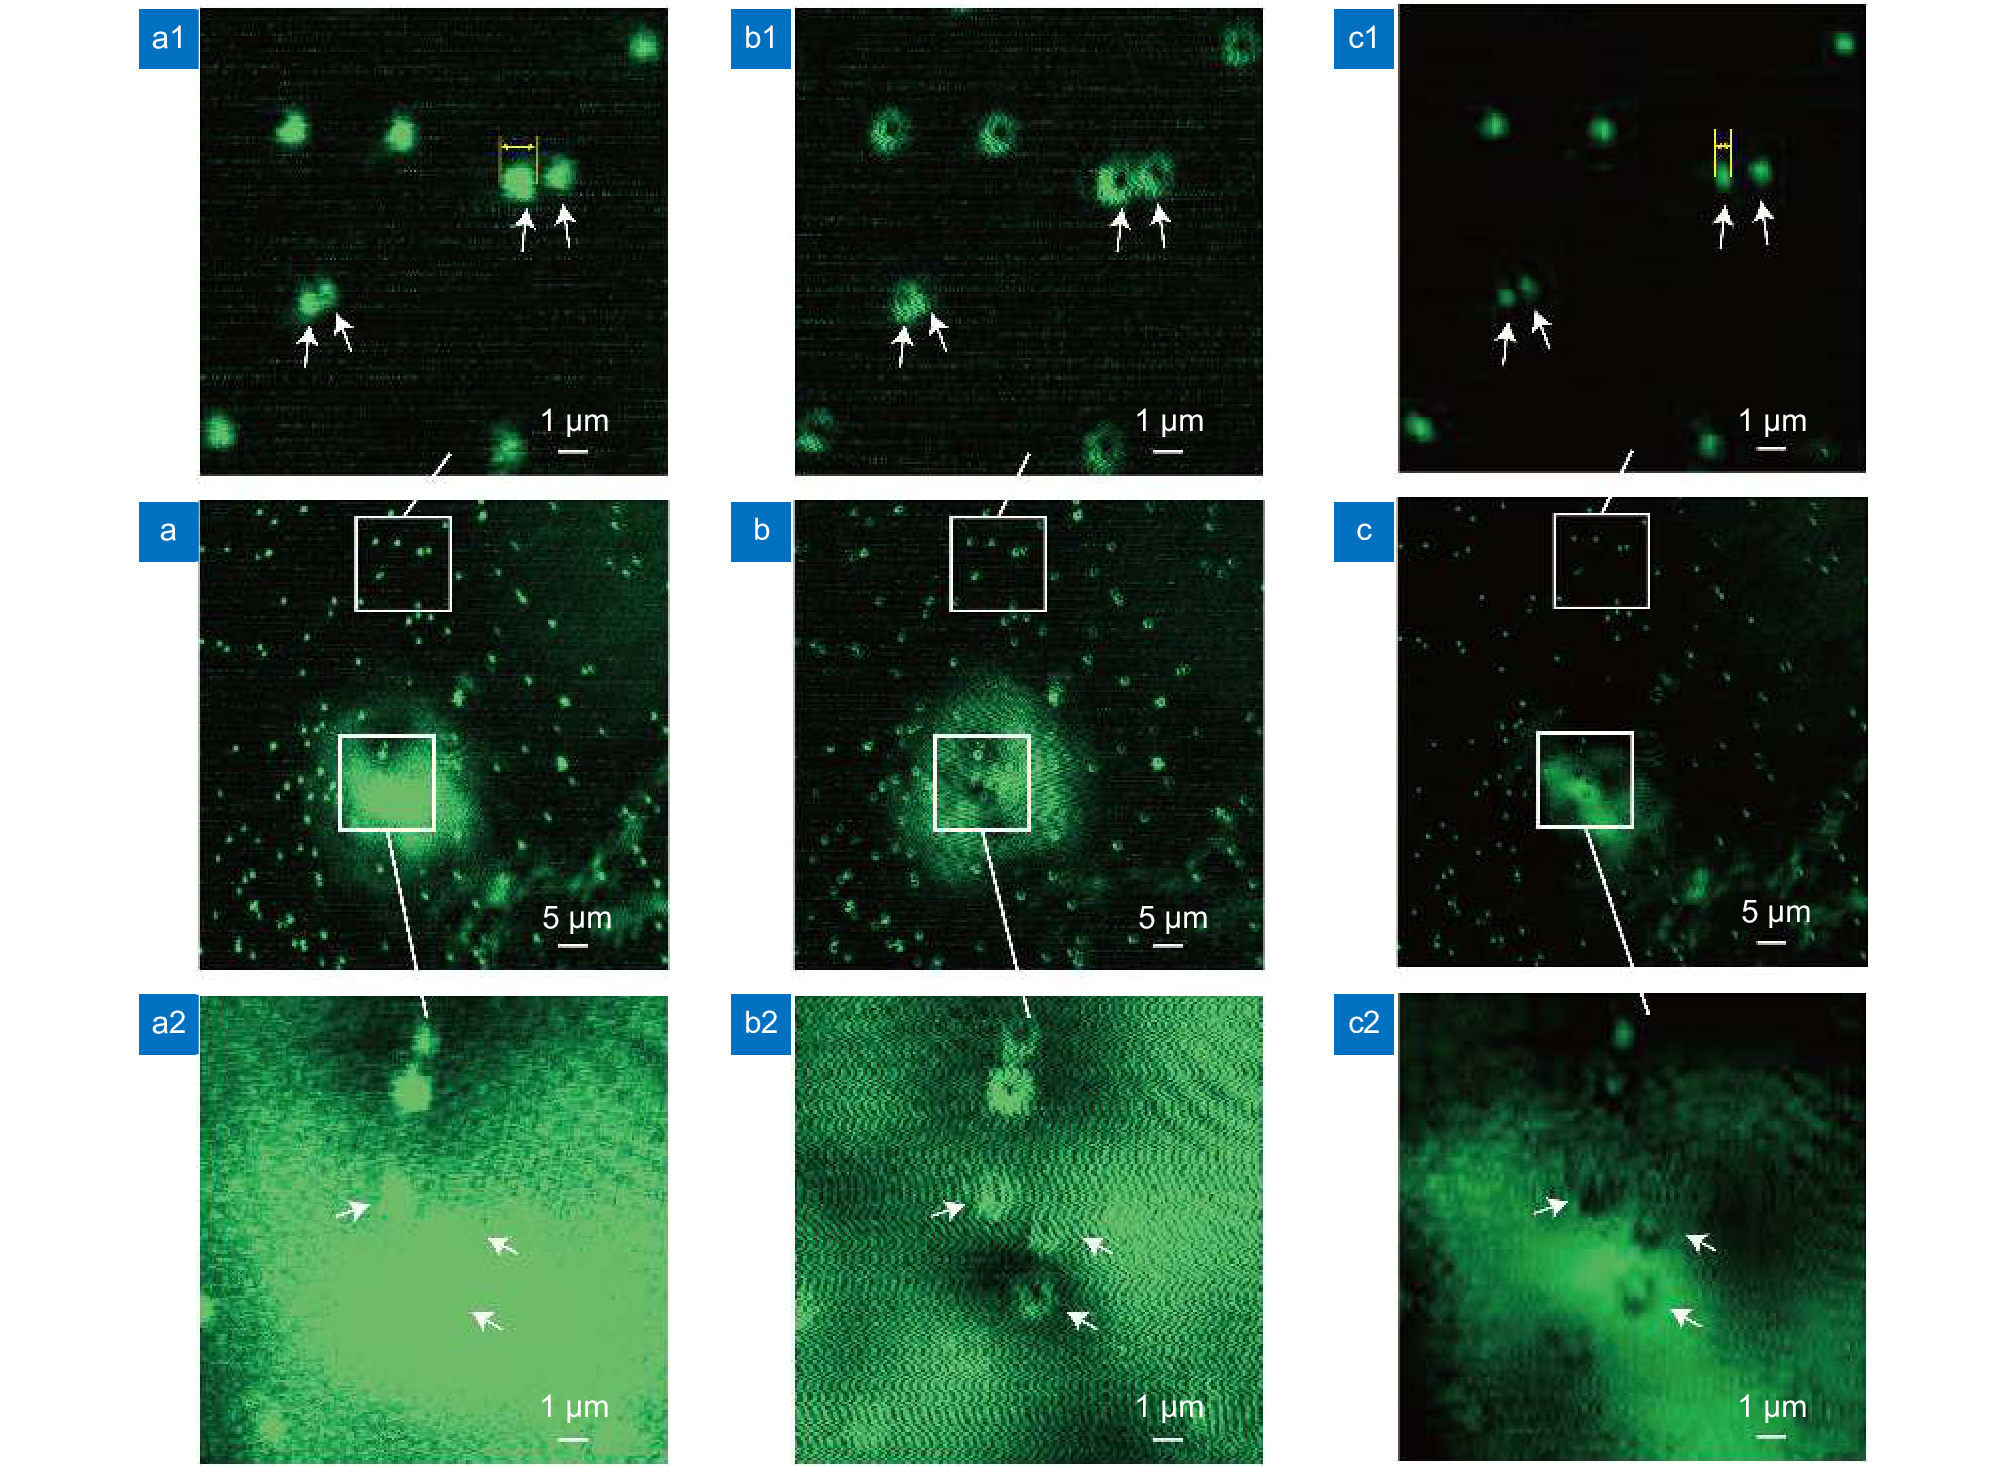
Figure 8.
Imaging result of gold particles using the FED system based on the fiber MSC. (a) Solid spot scanning; (b) Donut-shaped spot scanning; (c) Image of gold particle samples obtained by weighted subtraction of Figs. (a,b). Figures (a1-c1) and (a2-c2) are enlarged views of two different areas in Figs. (a-c), respectively
-
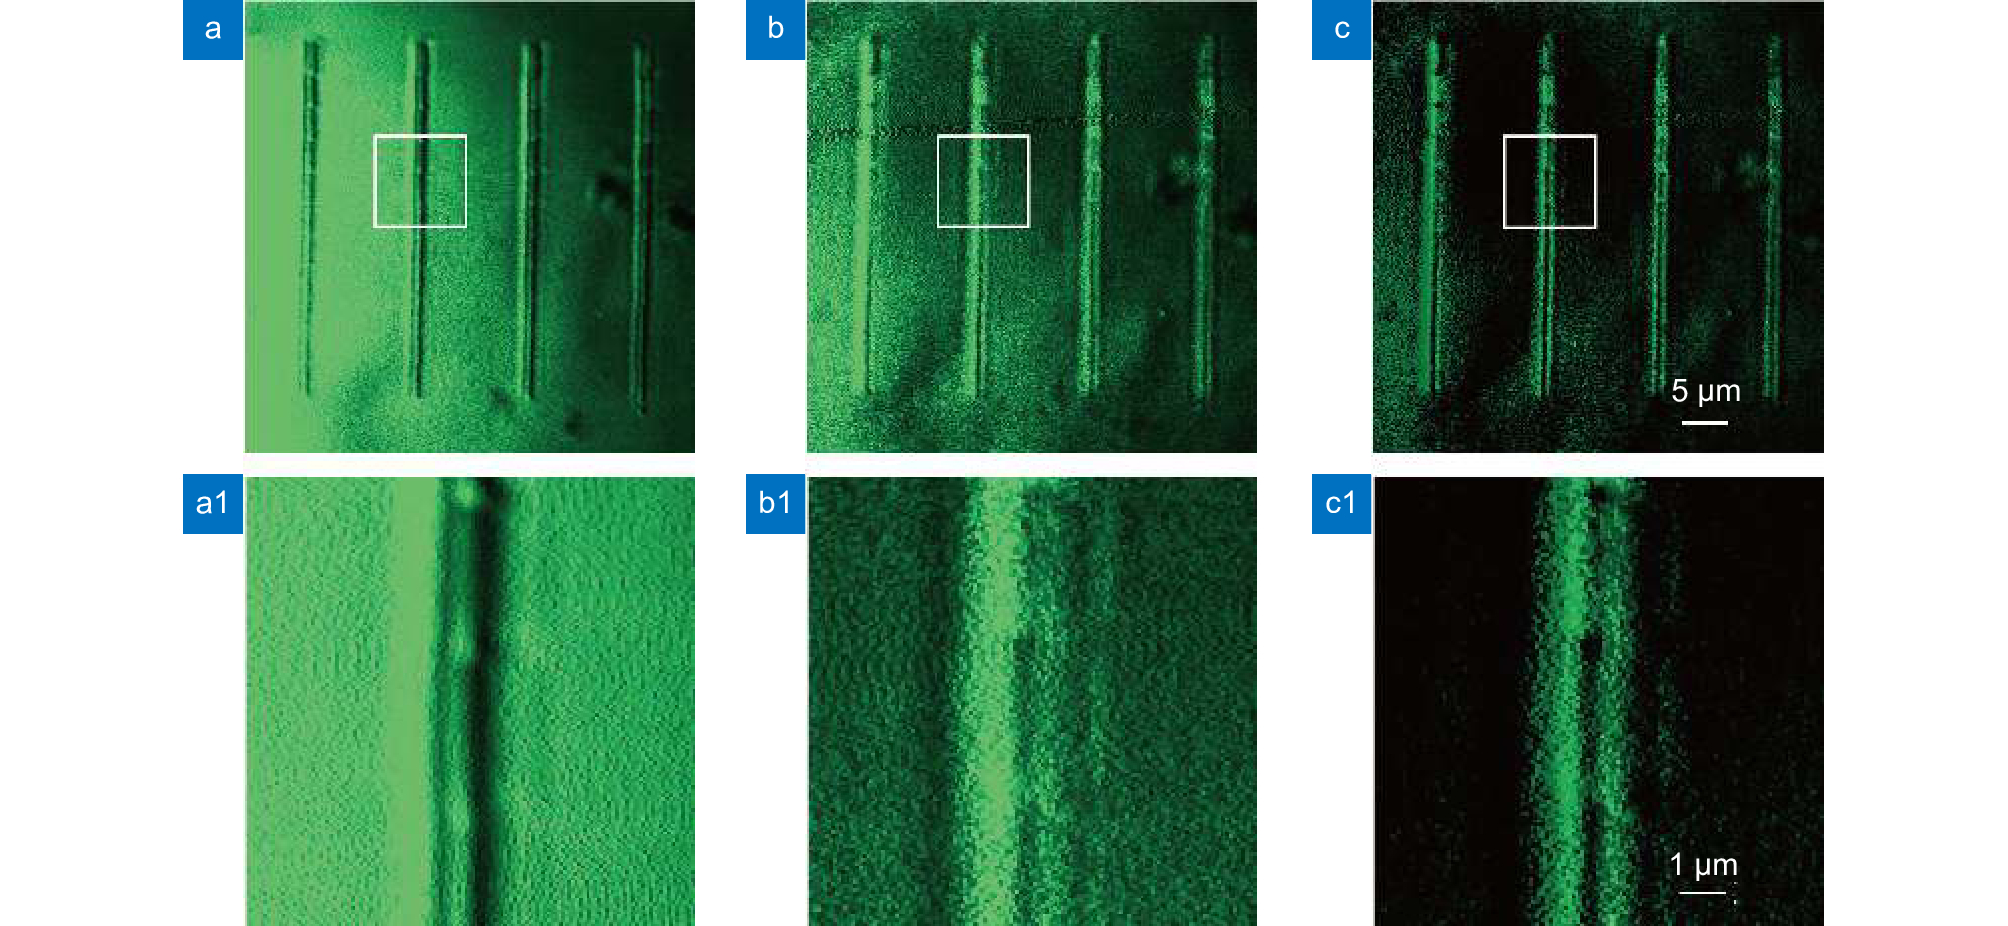
Figure 9.
Imaging result of nano-scale wire pairs using the FED system based on fiber MSC. (a) Solid spot scanning; (b) Donut-shaped spot scanning; (c) Image of nano-scale wire pairs obtained by weighted subtraction of Figs. (a, b)
- Figure .


