
 E-mail Alert
 RSS
RSS
| Citation: |

|
Research on dispersion compensation technology for SD-OCT system
-
Abstract
Dispersion compensation for the data processing of the spectral domain optical coherence tomography (SD-OCT) system is an important way to improve the imaging quality of the system. A dispersion compensation method for spectral domain optical coherence tomography based on numerical polynomial fitting analysis is proposed in this paper. This method obtains the dispersion factor by fitting the phase of the interference signal and removes the dispersion mismatch terms, which can significantly improve the system axial resolution compared with non-dispersion compensation. The SD-OCT system is used to measure the axial resolution and signal-to-noise ratio (SNR) at different positions of the optical path difference, and the effectiveness and reliability of the method are verified by analyzing the axial resolution and the SNR of the system before and after the dispersion compensation technology. Finally, we found that the third-order dispersion compensation has a visible optimization effect within the imaging depth of ~1.5 mm.-
Keywords:
- SD-OCT /
- dispersion compensation /
- polynomial fitting /
- resolution /
- imaging quality
-

-
References
[1] Huang D, Swanson E A, Lin C P, et al. Optical coherence tomography[J]. Science, 1991, 254(5035): 1178-1181. doi: 10.1126/science.1957169 [2] Fujimoto J G. Optical coherence tomography for ultrahigh resolution in vivo imaging[J]. Nat Biotechnol, 2003, 21(11): 1361-1367. doi: 10.1038/nbt892 [3] Drexler W, Morgner U, Kärtner F X, et al. In vivo ultra-high-resolution optical coherence tomography[J]. Opt Lett, 1999, 24(17): 1221-1223. doi: 10.1364/OL.24.001221 [4] Povazay B, Bizheva K, Unterhuber A, et al. Submicrometer axial resolution optical coherence tomography[J]. Opt Lett, 2002, 27(20): 1800-1802. doi: 10.1364/OL.27.001800 [5] Wang Y M, Zhao Y H, Nelson J S, et al. Ultrahigh-resolution optical coherence tomography by broadband continuum generation from a photonic crystal fiber[J]. Opt Lett, 2003, 28(3): 182-184. doi: 10.1364/OL.28.000182 [6] Fercher A F, Hitzenberger C K, Kamp G, et al. Measurement of intraocular distances by backscattering spectral interferometry[J]. Opt Commun, 1995, 117(1-2): 43-48. doi: 10.1016/0030-4018(95)00119-S [7] Leitgeb R, Hitzenberger C K, Fercher A F. Performance of Fourier domain vs. time domain optical coherence tomogra-phy[J]. Opt Express, 2003, 11(8): 889-894. doi: 10.1364/OE.11.000889 [8] de Boer J F, Cense B, Park B H, et al. Improved signal-to-noise ratio in spectral-domain compared with time-domain optical coherence tomography[J]. Opt Lett, 2003, 28(21): 2067-2069. doi: 10.1364/OL.28.002067 [9] Choma M A, Sarunic M V, Yang C, et al. Sensitivity advantage of swept source and fourier domain optical coherence tomography[J]. Opt Express, 2003, 11(18): 2183-2189. doi: 10.1364/OE.11.002183 [10] Hitzenberger C K, Baumgartner A, Drexler W, et al. Dispersion effects in partial coherence interferometry: implications for in-traocular ranging[J]. J Biomed Opt, 1999, 4(1): 144-151. doi: 10.1117/1.429900 [11] Jeon M, Kim J, Jung U, et al. Full-range k-domain linearization in spectral-domain optical coherence tomography[J]. Appl Opt, 2011, 50(8): 1158-1163. doi: 10.1364/AO.50.001158 [12] Ni G M, Zhang J, Liu L, et al. Detection and compensation of dispersion mismatch for frequency-domain optical coherence tomography based on A-scan's spectrogram[J]. Opt Express, 2020, 28(13): 19229-19241. doi: 10.1364/OE.393870 [13] Iyer S, Coen S, Vanholsbeeck F. Dual-fiber stretcher as a tunable dispersion compensator for an all-fiber optical coherence tomography system[J]. Opt Lett, 2009, 34(19): 2903-2905. doi: 10.1364/OL.34.002903 [14] Liu D, Ge C B, Xin Y, et al. Dispersion correction for optical coherence tomography by the stepped detection algorithm in the fractional Fourier domain[J]. Opt Express, 2020, 28(5): 5919-5935. doi: 10.1364/OE.379653 [15] Attendu X, Ruis R M, Boudoux C, et al. Simple and robust calibration procedure for k-linearization and dispersion compensation in optical coherence tomography[J]. J Biomed Opt, 2019, 24(5): 056001. [16] Singh K, Sharma G, Tearney G J. Estimation and compensation of dispersion for a high-resolution optical coherence tomography system[J]. J Opt, 2018, 20(2): 025301. doi: 10.1088/2040-8986/aaa2c0 [17] Marks D L, Oldenburg A L, Reynolds J J, et al. Autofocus algorithm for dispersion correction in optical coherence tomography[J]. Appl Opt, 2003, 42(16): 3038-3046. doi: 10.1364/AO.42.003038 [18] Yasuno Y, Hong Y, Makita S, et al. In vivo high-contrast imaging of deep posterior eye by 1-μm swept source optical coherence tomography and scattering optical coherence angiography[J]. Opt Express, 2007, 15(10): 6121-6139. doi: 10.1364/OE.15.006121 [19] Pan L H, Wang X Z, Li Z L, et al. Depth-dependent dispersion compensation for full-depth OCT image[J]. Opt Express, 2017, 25(9): 10345-10354. doi: 10.1364/OE.25.010345 [20] Liu X Y, Ke M Y, Yao X W, et al. Stable complex conjugate artifact removal in OCT using circularly polarized light as reference[J]. Opt Lett, 2020, 45(14): 3977-3980. doi: 10.1364/OL.395860 [21] Wang K, Ding Z H, Chen M H, et al. Deconvolution with fall-off compensated axial point spread function in spectral domain optical coherence tomography[J]. Opt Commun, 2011, 284(12): 3173-3180. doi: 10.1016/j.optcom.2011.02.074 -
Overview

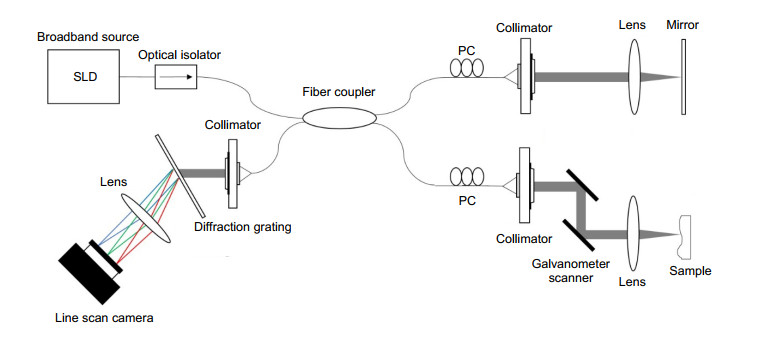
Overview: Optical coherence tomography (OCT) is an optical imaging modality that enables high-resolution, cross-sectional, and three-dimensional volumetric imaging of the internal microstructure in biological tissues and materials. SD-OCT system has a broadband source and a spectrometer with a line scan camera. One of the main problems of the SD-OCT system is that chromatic dispersion causes the decrease of sensitivity and imaging quality. Many different methods have been proposed, including hardware-based and software-based methods. Solutions include physically matching the dispersion in both arms by adding compensating materials, gratings, or fiber-stretchers in one of the interferometer arms. However, all these methods only compensate up to second-order dispersion and have the same pitfalls of complexity and cost. Various software-based methods have also been proposed to solve the problem of dispersion mismatch. Some rely on an iterative adjustment of a phase correction signal to optimize image sharpness.
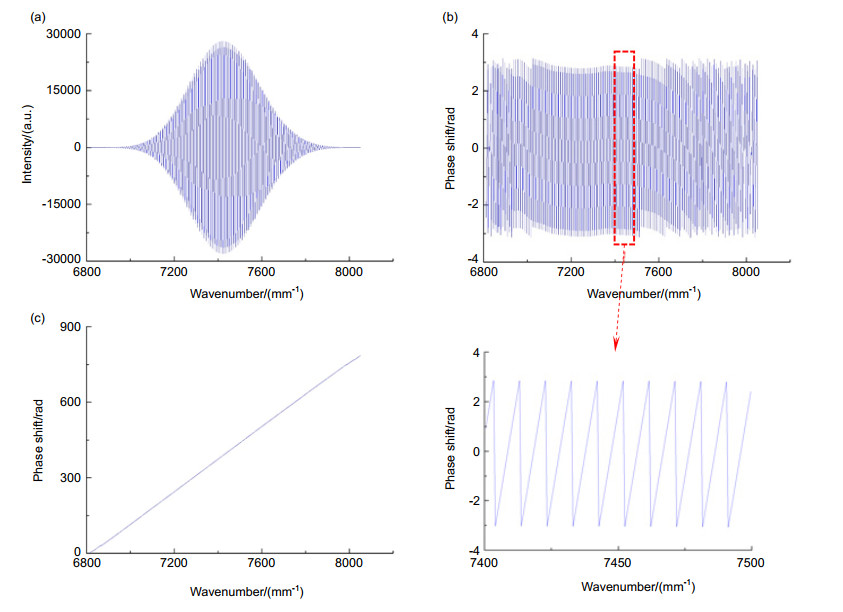
We propose a dispersion compensation method based on the numerical polynomial fitting analysis in the spectral domain optical coherence tomography. This method obtains the dispersion factor by fitting the phase of the interference signal and removes the dispersion mismatch terms, which can significantly improve the system axial resolution compared with non-dispersion compensation.
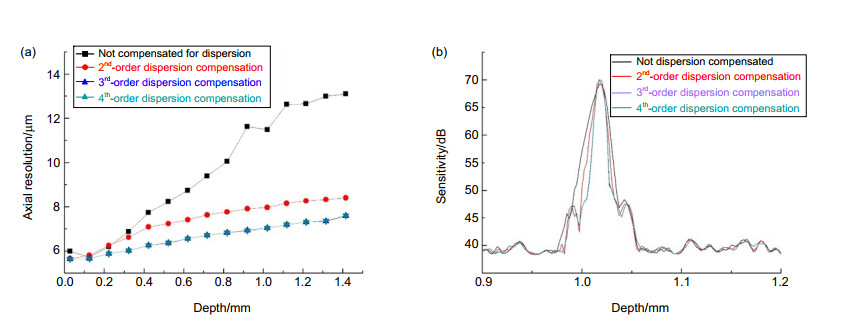
To illustrate that the numerical dispersion compensation method has an optimized effect on the axial resolution of the SD-OCT system, we measured the axial resolution at different depths and compared the PSF of 2nd-order, 3rd-order, and 4th-order dispersion compensation. The results prove that the axial resolution obtained by 3rd-order dispersion compensation is in good agreement with it measured by 4th-order dispersion compensation, and is better than it measured by non-dispersion compensation and 2nd-order dispersion compensation. The third-order dispersion compensation has a visible optimization effect.
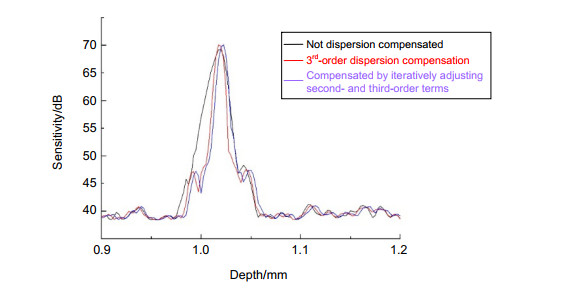
A comparison between the measured PSF by third-order numerical dispersion compensation and by the iterative dispersion compensation technique was carried out. The PSF is measured at the imaging depth of 1.02 mm. The measured FWHM with third-order dispersion compensation is ~7.5 µm and that with the iterative dispersion compensation technique is ~7.0 µm. The iterative dispersion compensation yields a little better resolution than the three-order dispersion compensation. However, it requires more computation.
The images of rubber hose and coverslip in the experiment are shown in the Figure. Using the method of the third-order dispersion compensation, two-dimensional imaging of rubber hose and coverslip are shown in Figure (c) and Figure (d), respectively. In order to contrast the effect of this method, the diagrams without dispersion compensation are shown in Figure (a) and Figure (b). The diagram with third-order dispersion compensation has a good sharpness in the deep position.
-
Access History

Export File
Citation
Format
Content
 DownLoad:

-
Figure 1.
Schematic of the SD-OCT system
-
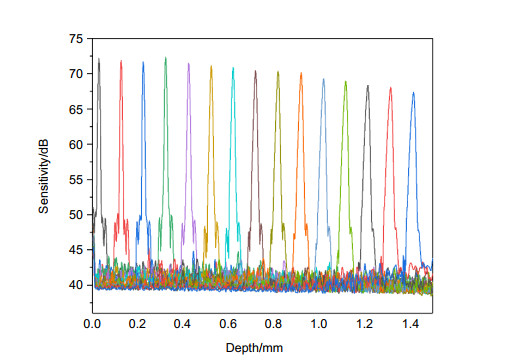
Figure 2.
The roll-off of the SD-OCT system
-
Figure 3.
The measured intensity and phase of the interference signal.
-
Figure 4.
The axial resolution and PSF with different order dispersion compensation.
-
Figure 5.
Comparison of the measured PSF with no dispersion compensation, third-order dispersion compensation, and numerical iterative compensation
-
Figure 6.
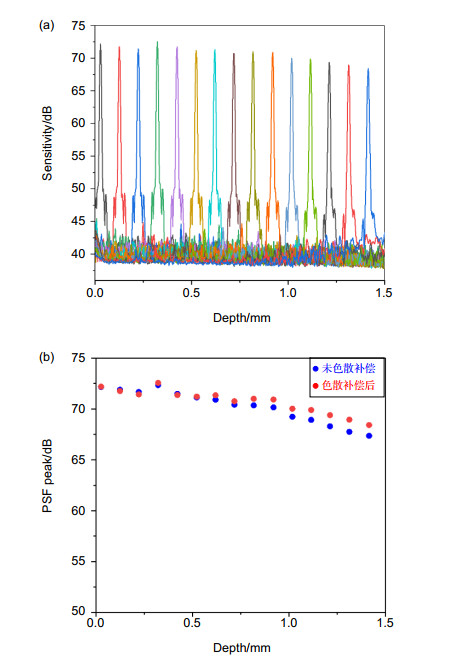
(a) The roll-off of the SD-OCT system with third-order dispersion compensation; (b) Comparison of PSF peak before and after dispersion compensation
-
Figure 7.
SD-OCT images of rubber hose and coverslip.


